


Managing maintenance and capital planning often feels overwhelming due to scattered data, aging infrastructure, and reactive fixes. The result? Costly delays, emergency repairs, and inefficiencies. But there’s a way out: centralized data and risk-based planning. Here’s the solution in a nutshell:
- Centralize asset data: Build a unified inventory, integrating static (e.g., age, specs) and dynamic (e.g., condition, performance) data.
- Use predictive models: Shift from guesswork to forecasting asset failures and prioritizing based on risk and cost impact.
- Adopt standardized tools: Metrics like the Facility Condition Index (FCI) and Capital Asset Priority Index (API) guide smarter decisions.
- Run scenario simulations: Test budget options to balance costs, risks, and outcomes.
- Align with ISO 55001: Create audit-ready, transparent plans that link investments to organizational goals.
Understanding Maintenance Backlogs and Fragmented Data
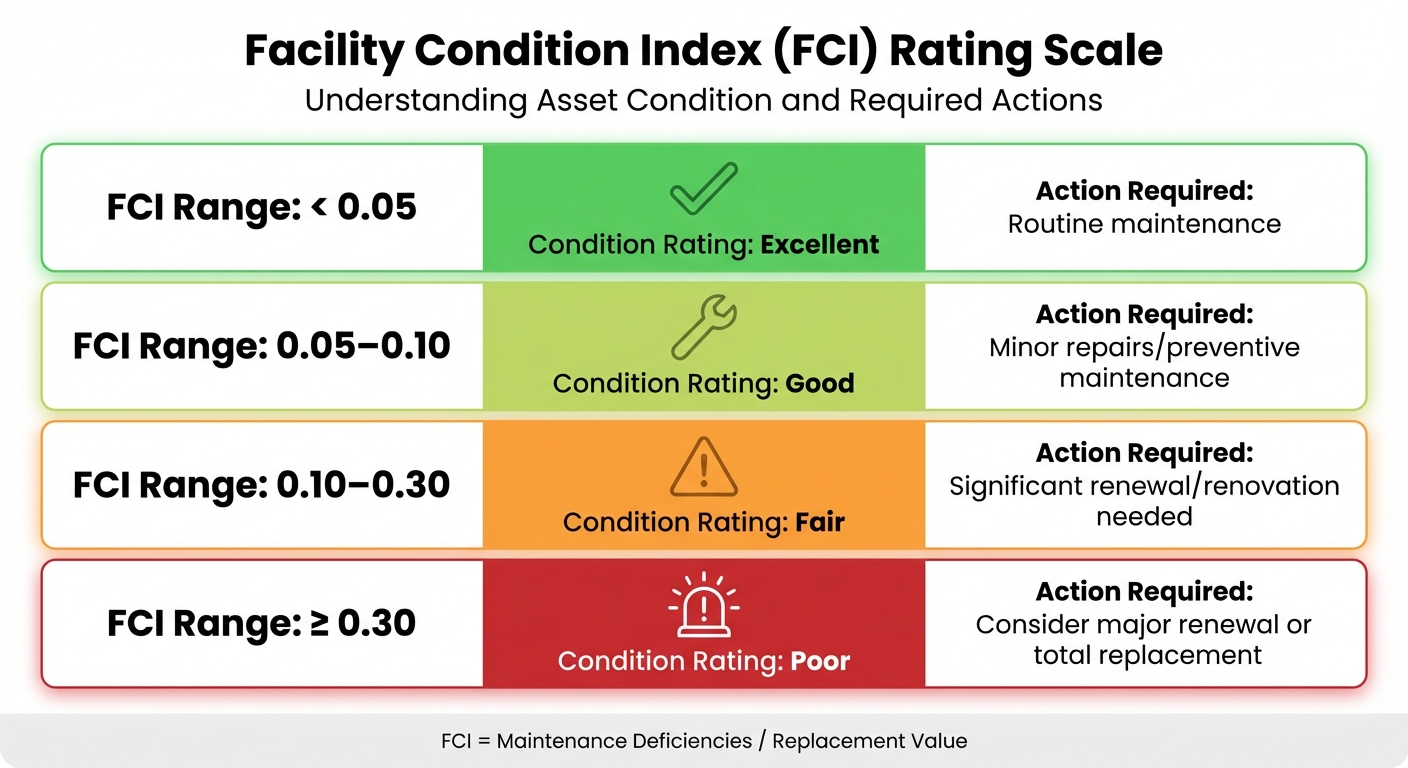
Facility Condition Index (FCI) Rating Scale and Required Actions
Why Maintenance Backlogs Happen
Maintenance backlogs tend to pile up over time, mainly because of limited resources, aging infrastructure, and a reactive approach to maintenance. Budget cuts and staff shortages often delay routine upkeep, and these delays can snowball into much bigger problems. For example, what starts as a simple HVAC filter replacement can escalate into a massive system overhaul costing millions. Laurentian University learned this the hard way in May 2025 when they had to spend $2.1 million addressing issues in their Alphonse Raymond building [5].
Aging infrastructure only makes things worse. As systems near the end of their lifespan, they start failing faster than they can be replaced – especially when financial planning is restricted to short, one-year cycles instead of more strategic, multi-year plans. A reactive maintenance mindset, where issues are fixed only after something breaks, compounds the problem. Preventive work takes a backseat, and planned projects are often postponed, further adding to the backlog.
This creates what experts call the "snowball effect." Small, delayed repairs turn into costly emergencies. For instance, poorly maintained HVAC systems not only break down but also waste energy, driving up utility bills. Structural issues can become safety hazards, leading to hefty fines. To cope with these challenges, about 87% of businesses outsource some maintenance tasks, often due to workforce shortages [7].
The growing backlog doesn’t just increase costs – it also disrupts the flow of data critical for making informed decisions.
How Fragmented Data Affects Decision-Making
As maintenance backlogs grow, they create another problem: fragmented data. Information about assets often ends up scattered across multiple systems. Work orders might sit in one platform, inspection reports in spreadsheets, and building automation data in yet another system. Without integration, decision-makers are left with an incomplete picture of asset health. Instead of relying on precise data, they often have to make decisions based on rough industry benchmarks or gut instincts [2].
This lack of clarity can lead to costly mistakes, like over-maintaining assets or replacing them too early simply because of their installation dates rather than their actual condition. On top of that, manual data entry in older CMMS systems introduces errors and delays, further complicating budget planning [6]. When building automation systems don’t communicate with each other, facility managers lose the ability to see which locations need immediate attention, leaving critical issues unaddressed.
The long-term consequences are serious. Without proper tracking, assets wear out faster, often needing to be replaced prematurely. This not only drives up costs but also reduces property value. Alarmingly, only about 35% of projects meet their original goals – often because poor data visibility leads to bad risk assessments and misdirected resources [9].
Baseline Assessment: Key Metrics and Tools
To shift from reactive fixes to planned investments, organizations need to measure their maintenance backlogs using standardized metrics. One of the most widely used tools for this is the Facility Condition Index (FCI). The FCI calculates the ratio of maintenance deficiencies to the replacement value of a facility, providing a clear snapshot of its condition. Here’s how it works:
| FCI Range | Condition Rating | Action Required |
|---|---|---|
| < 0.05 | Excellent | Routine maintenance |
| 0.05–0.10 | Good | Minor repairs/preventive maintenance |
| 0.10–0.30 | Fair | Significant renewal/renovation needed |
| ≥ 0.30 | Poor | Consider major renewal or total replacement |
An FCI score below 0.05 indicates a facility in excellent shape, while a score of 0.30 or higher signals serious issues requiring major renewal or even full replacement [10].
Predictive life-cycle modeling is another valuable tool. It provides faster and more affordable insights compared to traditional inspections, costing less than 20% of a full-field inspection and delivering results in about half the time [3]. Additionally, the UNIFORMAT II classification system helps standardize how building components – like Substructure, Shell, Interiors, and Services – are categorized. This makes it easier to compare assets across a portfolio. When combined with the Capital Asset Priority Index (API), the FCI can guide organizations in deciding which assets need immediate attention and which might be better candidates for divestment [11].
Centralizing Asset Data for Better Decisions
Building a Centralized Asset Inventory
Once you’ve evaluated your maintenance backlog, the next step is to create a comprehensive asset register. This involves documenting every asset with consistent details like its age, location, specifications, and remaining useful life. The goal? To replace the chaos of spreadsheets, outdated software, and disconnected systems with a single, reliable source of truth [13][14].
Start by deciding which assets to include. Many organizations prioritize buildings over 5,000 square feet or assets critical to their operations [3][1]. From there, use a standardized classification system like UNIFORMAT II, which organizes assets into three levels: Major Group Elements (e.g., Substructure or Shell), Group Elements (e.g., Foundations or Roofing), and Individual Elements (e.g., membrane roofing or HVAC units) [3]. This structured approach allows you to compare assets across different facilities, whether you’re managing hospitals, office buildings, or transportation infrastructure.
"To implement a portfolio-based facilities asset management program effectively, accurate data for the entire facilities portfolio is required to enable life-cycle decision making." – National Research Council [1]
It’s also essential to integrate both static data (like location and type) and dynamic data (like condition and performance). Static data provides a foundational understanding, while dynamic data highlights which assets are at risk and need immediate attention. Tools like Oxand Simeo™ bring both types of information together in a relational database, enabling calculations such as the Facilities Condition Index (FCI) and supporting the development of multi-year capital plans [12][3][1].
With a centralized inventory in place, you can streamline real-time data collection from the field, setting the stage for more efficient operations.
Digital Inspections and Data Capture
Relying on manual data entry often leads to errors and delays. For instance, technicians using clipboards must later transcribe their notes into spreadsheets, which increases the chance of mistakes. Digital inspection tools solve this problem by enabling field teams to capture data – like asset condition, risk, and performance – directly on-site using handheld devices [1].
Take Simeo GO, Oxand’s mobile inspection app, as an example. It allows technicians to conduct guided offline inspections, take photos, add comments, and record standardized condition scores. Once back online, all this data syncs automatically with the centralized Simeo™ platform. This real-time process minimizes human error and ensures decision-makers have up-to-date, accurate information for budget planning [1].
The advantages extend beyond accuracy. In 2009, the U.S. Coast Guard adopted Building Information Modeling (BIM) for facility planning. The result? A 98% reduction in the time and effort required to update their facility management database [1]. Such immediate data integration supports smarter, risk-based investment decisions.
Data Quality and Governance
Having centralized data and real-time capture is only valuable if the data itself is reliable. Poor-quality information can lead to costly mistakes, like replacing assets prematurely or overlooking critical failures until they escalate into emergencies. That’s why robust data governance is essential. It ensures accuracy, consistency, and audit-readiness across your entire portfolio.
To maintain data quality, establish clear protocols for data collection and validation, using frameworks like UNIFORMAT II. Implement validation rules to catch errors on the spot. For example, if a technician records a condition score that falls outside expected ranges, the system should flag it for review. Regular field audits are another key element. When using predictive life-cycle models, aim to verify at least 10% of facilities through thorough field inspections to ensure the models remain accurate [3].
"No data before their time… Every system and data item should be directly related to decision-making at some level." – National Research Council [1]
Adopt a risk-based approach to inspection scheduling. This means adjusting the frequency and detail of data collection based on an asset’s criticality and risk level, rather than following a fixed calendar. High-risk facilities might require annual updates, while less critical ones can be reviewed every three to five years. This approach not only keeps your inventory audit-ready but also avoids overburdening your team or budget [1]. For context, professional third-party condition assessments typically cost between $0.07 and $0.60 per square foot of building space, so prioritizing where to invest in detailed inspections is a smart financial move [1].
Turning Data into Risk-Based CAPEX Plans
Using Risk-Based Predictive Models
Once you have centralized and validated asset data, the next step is turning it into actionable CAPEX decisions. Predictive models can simulate how assets age, assess the likelihood of failure, and estimate the cost impacts. Instead of relying solely on age or generic manufacturer recommendations – which can lead to premature replacements or expensive breakdowns – these models calculate risk using two key components: Likelihood of Failure (based on factors like condition, age, and usage) and Consequence of Failure (impact on safety, reliability, and compliance) [4].
Oxand Simeo™ leverages a library of more than 10,000 proprietary aging and deterioration models, combined with over 30,000 maintenance rules developed over two decades. This method doesn’t require deploying a dense network of IoT sensors on every asset. Instead, it uses probabilistic modeling applied to existing data – such as inspection reports, work orders, and asset attributes – to predict performance over the asset’s lifecycle. This allows you to identify which assets require immediate attention and which can safely be deferred.
Here’s the kicker: predictive modeling can cost less than 20% of a full-field assessment and delivers results in half the time [3]. On top of that, incorporating advanced analytics into infrastructure planning can lead to savings of 5% to 15% across your portfolio [2].
"Replace too early and waste remaining asset life. Replace too late and pay through failures, maintenance, penalties or lost throughput." – Philippe Jetté, Product Manager, Asset Investment Planning, IBM [4]
Once risks are quantified, the next step is to evaluate these findings using operational and strategic priorities.
Multi-Criteria Prioritization Frameworks
Risk assessments are just the beginning. A structured prioritization framework ensures that asset decisions align with both their condition and broader organizational goals. A multi-criteria framework evaluates assets across various factors – not just their physical state, but also their importance to operations, lifecycle costs, environmental considerations, and regulatory compliance.
Start by defining a Lifecycle Value Framework that reflects your organization’s priorities. For example, if safety and environmental performance are high on your list, the framework should account for failure costs in those terms, factoring in not just repair expenses but also lost revenue, fines, and carbon emissions. Tools like the Capital Asset Priority Index (API), a standard under ASTM E-2495, help assess the criticality of a facility to your organization’s mission. When combined with the Facility Condition Index (FCI), you can create a matrix to determine which assets need increased investment and which might be candidates for divestment [11].
This approach moves beyond subjective decision-making. By linking capital expenditures (CAPEX), operational expenditures (OpEx), and resource needs to each intervention strategy – whether it’s running to failure, maintaining, refurbishing, or replacing – you can objectively compare options. A rolling planning cycle, typically 12 to 18 months, allows for quarterly adjustments based on updated failure data, condition assessments, and budgets [4].
Scenario Simulations for Budget Optimization
After prioritizing risks, scenario simulations can help fine-tune your CAPEX budget. Even with a solid prioritization framework, tough decisions remain: Should you invest more now to reduce long-term risks, or stick with current spending levels and accept higher failure rates? Scenario simulations let you explore these "what-if" scenarios without committing actual funds.
With Oxand Simeo™, you can run multiple budget scenarios to visualize the trade-offs. For example, one simulation might show that increasing targeted refurbishments by 10% could reduce the total cost of ownership by 22% over the long term compared to flat-funding models [4]. Another could reveal that reallocating the same budget across different asset classes – using a unified risk measurement – can boost reliability by 94% without additional spending [15]. In one case, a North American utility cut capital expenditures by 40% to 60% while maintaining the same level of risk [15].
Between 2020 and 2025, San Diego Gas & Electric (SDG&E) revamped its capital project management by integrating space and preventive maintenance data with SAP financial systems through the Eptura platform. This transformation extended their planning horizon from one year to three years. Over five years, SDG&E’s annual capital project budget grew from $5–$7 million to over $40 million, all while reducing risks of budget overruns and project delays [8].
Simulations can also identify areas where assets are being over-maintained – so-called "budgetary sinkholes" – and suggest that replacement might offer a better return on investment than continued maintenance. By incorporating energy usage and occupancy data, you can calculate the ROI of energy-efficiency upgrades or renewable energy projects, ensuring your CAPEX plan aligns with both financial goals and environmental objectives.
"Data gives you information, and that information turns into knowledge. Knowledge gives you understanding of the issue and understanding allows you to make wise decisions." – Cameron Christensen, Director of Asset Management for Facilities Operations, Princeton University [8]
sbb-itb-5be7949
Creating Audit-Ready, ISO 55001-Compliant Plans
Aligning with ISO 55001 Standards
Achieving ISO 55001 compliance begins with a Strategic Asset Management Plan (SAMP) that links your organization’s goals to specific asset-related actions. The standard follows a "Plan-Do-Check-Act" cycle, emphasizing regular performance audits, tracking key performance indicators (KPIs), and ensuring transparent, traceable decision-making processes.
To align with ISO 55001, your CAPEX plan must outline procedures for managing assets throughout their entire lifecycle. A critical step is classifying assets by their impact on operations, safety, and financial performance – assigning them as high, medium, or low priority. For example, high-priority assets like main air compressors or boiler feed pumps demand greater maintenance and investment focus compared to lower-priority items like utility fans or lighting panels.
Using a RACI matrix combined with Asset Priority Index (API) and Facility Condition Index (FCI), you can effectively prioritize high-criticality assets. Those with both high API and poor FCI – assets crucial to operations but in deteriorating condition – should receive the most attention and funding.
Unplanned downtime is a costly issue, with manufacturers losing an average of $25,000 per hour and up to $500,000 in extreme cases [16]. Additionally, in 2023, businesses faced approximately $132.3 million in penalties for violations of OSHA‘s top 10 regulations [16]. Implementing ISO 55001 can reduce downtime by 30.6% and increase preventive maintenance compliance from 68% to 86% [18]. This structured framework not only ensures compliance but also sets the stage for integrating sustainability into your investment strategies.
Carbon-Aligned Investment Planning
Modern CAPEX planning isn’t just about meeting regulations – it’s also about advancing sustainability. ISO 55001 encourages organizations to integrate goals like energy efficiency and carbon reduction into their broader Value Framework [17]. Tools like Oxand Simeo™ offer sustainability modules that help model energy performance and carbon reduction strategies across entire portfolios. By incorporating these factors into your multi-year CAPEX plan, you can evaluate energy upgrades alongside lifecycle costs, ensuring decisions align with both financial and environmental objectives.
For instance, when comparing refurbishment versus replacement options, platforms like Simeo™ calculate the return on investment (ROI) for energy-efficient upgrades – such as modernizing HVAC systems or adopting renewable energy solutions – while factoring in traditional lifecycle costs.
"End-of-life" risks are a major component of total lifecycle costs and have a direct impact on environmental performance [4].
Deferring asset replacements can lead to higher energy usage, increased carbon emissions, and even regulatory penalties. By quantifying these costs, you can make informed decisions about when to retire outdated, inefficient assets. This approach shifts the focus from fixed schedules to knowledge-based assessments, aligning with current operational needs and sustainability standards [3].
The outcome? A carbon-focused investment plan that demonstrates how your CAPEX decisions enhance both operational reliability and climate commitments. These plans are particularly beneficial for organizations navigating European energy regulations or aiming to showcase their ESG performance to investors and boards.
Presenting Transparent, Audit-Ready Plans
To build trust and credibility, your CAPEX plan must be audit-ready. This means every recommendation should be traceable, well-documented, and logically defensible. Each investment should connect directly to asset attributes, inspection results, failure history, and risk assessments – forming a "condition-to-capital" pipeline [4]. Such documentation ensures that auditors, boards, and stakeholders can clearly follow the reasoning behind budget allocations.
Oxand Simeo™ simplifies this process by generating ISO 55001-aligned, audit-ready plans directly from your data. The platform ensures workflows are fully auditable, capturing decision-making logic and approval processes [17]. Presenting a CAPEX plan then becomes more than listing projects and costs – it’s about showing how each investment mitigates risks, aligns with strategic goals, and delivers measurable value within financial, resource, and sustainability constraints.
"A data‑driven, long‑term AIP process… turns policy into a repeatable, auditable decision process – not a one‑off spreadsheet exercise."
– Philippe Jetté, Product Manager, Asset Investment Planning, IBM [4]
Transparency also involves addressing trade-offs. Scenario simulations can illustrate the implications of different funding levels. For example, what risks remain if the budget is reduced by 15%? How much reliability improves with a 10% increase? These visual tools help stakeholders grasp the impact of their financial decisions, making it easier to secure necessary investments.
"Data and information can be the basis of higher situational awareness during decision-making, of transparency during the planning and execution of maintenance and repair activities… and of increased accountability."
– National Research Council [1]
Conclusion: From Backlogs to Investment Plans
Start by consolidating your asset inventory into a single, detailed database, then incorporate condition assessments to translate risks into tangible financial terms. Develop a risk framework that treats end-of-life risks as real financial costs, evaluating the likelihood and consequences of failures in areas like safety, reliability, and operations. These foundational steps pave the way for reducing costs and mitigating risks, with the added benefits outlined below.
This method delivers clear financial savings and operational improvements. For example, one railway company shifted $20 million annually from routine maintenance to strategic capital replacements by leveraging condition-monitoring data instead of relying on industry benchmarks. This change also saved 30,000 person-hours each year [2]. Similarly, a utility company used scenario-based simulations to guide targeted refurbishments, cutting total ownership costs by 22% over time compared to flat-budget strategies [4].
Beyond just saving money, this shift helps reduce risks and aligns investments with broader sustainability goals. By quantifying the costs of delaying projects and the impact of energy upgrades, a capital expenditure plan evolves from a basic budgeting exercise into a strategic roadmap. Transitioning from reactive maintenance to predictive, risk-based planning minimizes unplanned shutdowns, improves resource allocation, and supports both operational efficiency and environmental objectives.
You don’t need perfect data to begin this transformation. Follow the 80/20 rule: prioritize improving the factors that influence 80% of asset performance [4]. Implement a rolling 12-to-18-month planning cycle, adjusting quarterly based on actual work history and unexpected failures [4]. This approach turns capital planning into a reliable, repeatable process that earns stakeholder trust and delivers long-term value.
FAQs
How do predictive models enhance maintenance planning and help reduce costs?
Predictive models take a proactive approach by analyzing data from sensors, inspections, and historical records to predict when an asset might begin to deteriorate. Instead of waiting for something to break or sticking to rigid maintenance schedules, this method shifts organizations to condition-based maintenance – addressing potential issues just before they happen. The payoff? Fewer last-minute fixes, less downtime, longer asset lifespans, and lower overall costs.
The impact of predictive models is impressive. They can trim maintenance budgets by 10–20%, cut failures by as much as 70%, and extend the life of assets by 20–40%. But it’s not just about saving money. These models also help organizations prioritize spending more effectively, aligning budgets with long-term goals while keeping operations running smoothly.
How does centralizing data help turn maintenance backlogs into actionable investment plans?
Centralizing data plays a crucial role in turning a disorganized maintenance backlog into a clear, risk-focused CAPEX investment plan. By bringing together details like work orders, asset conditions, inventories, and cost histories into one dependable system, organizations can break down data silos and gain a comprehensive view of their assets. This unified perspective helps decision-makers pinpoint aging infrastructure, expensive failures, and the risks tied to delayed maintenance.
With this streamlined approach, investments can be prioritized using real-time, measurable data instead of relying on gut feelings. Tools like predictive analytics add even more value by forecasting asset failures, estimating lifecycle costs, and identifying high-risk areas. This makes it possible to develop multi-year investment plans that align with budget limits, long-term asset durability, and even sustainability objectives. In essence, centralizing data transforms a static list of maintenance tasks into a dynamic, strategic plan for smarter and more transparent decision-making.
How do the Facility Condition Index (FCI) and Capital Asset Priority Index (API) help prioritize CAPEX investments?
The Facility Condition Index (FCI) and Capital Asset Priority Index (API) play a crucial role in simplifying complex asset data into actionable capital expenditure (CAPEX) strategies. The FCI is calculated by comparing the cost of repairs or rehabilitation to the total replacement value of an asset, expressed as a percentage. This straightforward metric is a quick way to identify which buildings or systems are in the worst condition and need immediate attention.
The API takes the FCI a step further by factoring in additional elements such as asset criticality, risk of failure, regulatory compliance, and budget constraints. By ranking assets and projects based on these criteria, the API helps decision-makers zero in on high-risk, high-impact areas. In essence, the FCI pinpoints what needs attention, while the API determines what should be prioritized first, ensuring funds are directed toward reducing emergency repairs and enhancing overall asset performance.
Related Blog Posts
- Infrastructure Asset Management: A Risk-Based Approach for Multi-Year CAPEX Planning
- Strategic CAPEX Planning for Highway Concessions: Balancing Grantor Compliance and Profitability at End-of-Term
- Aging Infrastructure in Europe: How to Prioritise Renewal Under Budget Constraints
- How to Calculate the Real ROI of Predictive Maintenance (and Feed It into Your Investment Plan)