


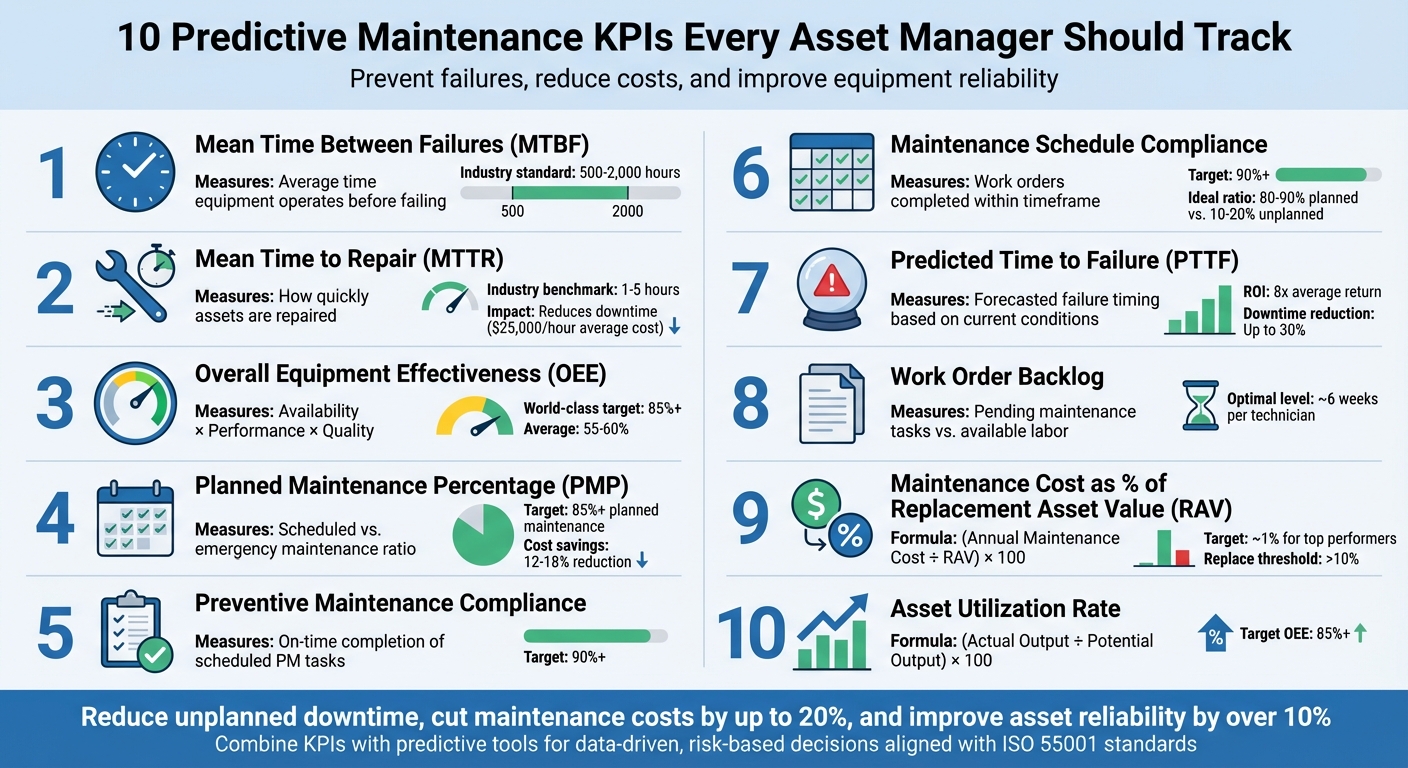
Predictive maintenance KPIs help asset managers prevent failures, reduce costs, and improve equipment reliability. These metrics combine historical data with future-focused insights, enabling smarter decisions about when and how to maintain assets. Using tools like Oxand Simeo™, organizations can optimize maintenance schedules, extend asset lifespans, and align with standards like ISO 55001. Below are the 10 key KPIs you should monitor:
- Mean Time Between Failures (MTBF): Measures reliability by tracking the average time equipment operates before failing.
- Mean Time to Repair (MTTR): Tracks how quickly assets are repaired, reducing downtime.
- Overall Equipment Effectiveness (OEE): Evaluates efficiency through availability, performance, and quality.
- Planned Maintenance Percentage (PMP): Shows the ratio of scheduled to emergency maintenance.
- Preventive Maintenance Compliance: Tracks how often scheduled maintenance is completed on time.
- Maintenance Schedule Compliance: Measures adherence to planned maintenance timelines.
- Predicted Time to Failure (PTTF): Forecasts when an asset might fail based on current conditions.
- Work Order Backlog: Monitors pending maintenance tasks and resource allocation.
- Maintenance Cost as Percentage of Replacement Asset Value (RAV): Compares annual maintenance costs to asset replacement value.
- Asset Utilization Rate: Assesses how effectively assets are used compared to their potential.
Why these KPIs matter: Monitoring these metrics helps reduce unplanned downtime, cut maintenance costs by up to 20%, and improve asset reliability by over 10%. Combining these KPIs with predictive tools enables smarter, data-driven decisions that balance cost, risk, and long-term sustainability.
10 Essential Predictive Maintenance KPIs for Asset Managers
1. Mean Time Between Failures (MTBF)
Why This KPI Matters for Predictive Maintenance
Mean Time Between Failures (MTBF) measures how long a piece of equipment typically runs before it experiences a failure. It’s a critical metric for gauging reliability and planning ahead. For context, industry standards often place MTBF somewhere between 500 and 2,000 hours, though this figure can vary depending on the type of equipment being used [9].
By analyzing MTBF, maintenance shifts from being reactive to proactive. Instead of waiting for something to break, you can use past failure data to anticipate future problems [7][8]. This means maintenance becomes a planned, strategic operation rather than a guessing game.
How It Affects Asset Lifecycle Costs
Keeping an eye on MTBF can have a direct impact on your costs. For instance, imagine an HVAC system with an MTBF of about 181 days (roughly 4,362 hours). Scheduling preventive maintenance at least twice a year ensures small issues are caught early, helping avoid expensive emergency repairs [7].
MTBF also provides insight into how effectively your team is addressing problems. Are they solving the root causes of failures, or just patching symptoms? This data can guide smarter decisions about whether to repair or replace equipment. For assets nearing the end of their lifecycle, MTBF trends might signal it’s time to consider a replacement rather than continuing with costly fixes [10].
How It Works with Predictive Tools like Oxand Simeo™
Platforms like Oxand Simeo™ take MTBF to the next level. Simeo™ combines MTBF data with an extensive database of over 30,000 maintenance laws to predict how components will perform over time. Instead of just looking at past performance, it uses MTBF as a forward-looking tool to guide investment and maintenance decisions.
Through probabilistic modeling, Simeo™ processes existing asset data to pinpoint the best times for maintenance and budget allocation. Even with incomplete data, the platform can accurately predict how assets will age and degrade. This approach turns MTBF into a proactive tool, enabling smarter, risk-based planning for the future.
How It Helps with Risk-Based Planning Decisions
MTBF serves as a solid foundation for making ISO 55001-compliant, risk-based planning decisions. By monitoring MTBF trends, you can spot declining performance and investigate whether the root issue lies in poor maintenance practices, tough operating conditions, or flaws in the design itself [10].
"While intuition can provide a hunch or spark that starts you down a particular path, it’s through data that you verify, understand, and quantify." – Harvard Business School [8]
Additionally, MTBF helps allocate resources more effectively. Equipment with lower MTBF values often requires more frequent maintenance and higher costs, while assets with higher MTBF values are more reliable, allowing for longer maintenance intervals and better cost efficiency. This data-driven strategy ensures every maintenance dollar is well spent, reducing overall ownership costs while keeping performance levels high.
2. Mean Time to Repair (MTTR)
Why This KPI Matters for Predictive Maintenance
Mean Time to Repair (MTTR) measures how long, on average, it takes to fix a failed asset [8][10]. In simpler terms, it reflects how quickly your team can recover from equipment breakdowns. A lower MTTR means faster repairs, reducing downtime and minimizing production losses [8][14].
In the context of predictive maintenance, MTTR is more than just a historical metric – it becomes a tool for planning. Knowing typical repair times allows for better scheduling of maintenance tasks and aligning them with production demands [7]. This shifts MTTR from being a reactive measure to a proactive guide for improving maintenance efficiency [3]. Industry benchmarks suggest MTTR usually falls between 1 and 5 hours, though this depends on how complex the equipment is [9]. Paired with MTBF (Mean Time Between Failures), MTTR provides a full view of both how often failures occur and how efficiently they’re addressed.
How It Affects Asset Lifecycle Costs
Unplanned downtime can be expensive – around $25,000 per hour – so reducing MTTR directly impacts your bottom line by cutting losses and improving operational efficiency [13]. Reactive maintenance, which often lacks planning, leads to 3.3 times more downtime and 16 times more defects compared to proactive approaches [9].
Monitoring MTTR can also uncover inefficiencies. For example, prolonged repair times might point to issues like delays in getting spare parts, insufficient technician training, or overly complicated repair processes [9][14]. A great example of this comes from Ahlstrom, a company that slashed monthly repair hours by 90% after implementing a mobile-first CMMS platform [9].
"Since adoption, our Mean Time to Repair has decreased from 580 to 60 hours a month." – Engineering Manager, Ahlstrom [9]
How It Works with Predictive Tools like Oxand Simeo™
Modern predictive platforms simplify MTTR tracking by automating the process. For instance, they can start the repair timer as soon as the issue is logged, ensuring precise data [16][8].
Oxand Simeo™ takes this a step further. It combines MTTR data with its extensive database of over 30,000 maintenance laws to identify patterns across your assets. This platform helps pinpoint whether high MTTR is caused by asset complexity, skill gaps among technicians, or delays in parts availability [11]. By diagnosing the root causes, you can address the core issues instead of just treating the symptoms. If MTTR continues to climb despite preventive measures, Simeo™ can even help calculate whether replacing the asset would be more cost-effective than ongoing repairs [16][11].
How It Helps with Risk-Based Planning Decisions
MTTR data plays a key role in ISO 55001-compliant risk-based planning by highlighting assets with extended repair times [15][13]. When combined with other metrics, MTTR provides actionable insights that help you allocate resources strategically. This could mean investing in technician training, refining repair documentation, or prioritizing the replacement of certain assets.
"MTTR is a powerful metric in planning and scheduling preventive maintenance because it gives you an estimate of the required downtime for repairs." – Sarah Laubach, Content Specialist, FMX [16]
Tracking MTTR alongside metrics like MTBF and OEE (Overall Equipment Effectiveness) gives a more complete picture of your maintenance performance. Together, these KPIs reveal how fast repairs prevent recurring issues, helping you make smarter decisions about where to allocate your maintenance budget [3][17].
3. Overall Equipment Effectiveness (OEE)
Why This KPI Matters for Predictive Maintenance
OEE combines three critical factors – Availability, Performance, and Quality – to measure how efficiently equipment operates [6][15]. Availability looks at how much uptime your equipment has compared to planned production time. Performance measures whether machines are running at their optimal speed, and Quality tracks how many defect-free units are produced. Together, these metrics provide a real-time snapshot of operational performance.
When it comes to predictive maintenance, OEE is a powerful early warning system. A drop in OEE can indicate that something is starting to go wrong – whether it’s a decrease in uptime, slower operations, or an increase in defects – long before a major failure happens. While achieving a world-class OEE score of 85% or higher is ideal, many manufacturers hover between 55% and 60% [13][15]. This gap highlights where maintenance efforts should focus to close the performance gap. Like MTBF and MTTR, OEE offers actionable insights that help prevent costly downtime.
How It Affects Asset Lifecycle Costs
Low OEE can hit your bottom line hard. Unplanned equipment failures cost an average of $25,000 per hour [13]. Emergency repairs are also expensive, running 3 to 10 times more than planned maintenance, while reactive losses can be 5 to 20 times higher [20].
"OEE is the gold standard that maintenance managers use to assess how well equipment is performing based on three factors: its availability, performance, and quality." – Vector Solutions [20]
Tracking OEE helps in making smarter decisions about whether to repair or replace equipment. For instance, if annual maintenance costs exceed 10% of an asset’s replacement value, it might be more cost-effective to replace it [13]. A great example is Rimex, a tire and rim manufacturer, which cut unplanned downtime by 30% by monitoring asset performance through their CMMS platform [10]. Companies that align preventive maintenance with OEE data have even reported returns on investment as high as 545% [20].
How It Works with Predictive Tools like Oxand Simeo™
Modern predictive maintenance platforms take OEE to the next level by integrating it with real-time sensor data, such as temperature, vibration, and pressure. This combination can reduce equipment downtime by up to 30%, improve efficiency by 20%, and lower defect rates by 15% [19].
Oxand Simeo™ is a standout tool in this space. It uses OEE trends along with a massive database of over 30,000 maintenance laws and 10,000+ proprietary aging models. Instead of relying heavily on sensors, Simeo™ uses probabilistic modeling to predict how assets will age [11]. When OEE scores fall below a certain threshold, the platform triggers a Root Cause Analysis to pinpoint whether the issue stems from maintenance practices, equipment condition, or operational factors [10]. This real-time feedback helps fine-tune risk-based investment strategies.
How It Helps with Risk-Based Planning Decisions
OEE plays a key role in ISO 55001-compliant, risk-based planning by showing exactly where production losses occur [15]. Its three components – Availability, Performance, and Quality – help identify whether the problem lies in downtime, reduced speed, or quality issues. For example, low Availability suggests downtime needs to be reduced with better preventive maintenance, while poor Performance might indicate speed losses or frequent minor stops [15]. These insights allow for smarter allocation of maintenance budgets and better overall planning to minimize risks and maximize efficiency.
4. Planned Maintenance Percentage (PMP)
Why This KPI Matters for Predictive Maintenance
Planned Maintenance Percentage (PMP) measures how much maintenance time is spent on scheduled tasks versus emergency fixes. It’s calculated by dividing planned maintenance hours by total maintenance hours, then multiplying by 100. Ideally, a PMP of 85% or higher reflects a proactive approach that prevents issues before they snowball. On the flip side, a PMP below 50% suggests a reactive cycle where emergencies dominate [17][21].
"Leading KPIs lead to results; lagging KPIs are the results. If you are managing maintenance without accurate leading and lagging KPIs, then you are lost." – Ricky Smith, Expert in Residence, UpKeep [21]
How It Affects Asset Lifecycle Costs
Emergency repairs are expensive – think overtime wages, rush shipping fees, and temporary fixes that don’t address root causes [17]. Switching to preventive maintenance can cut costs by 12% to 18% [21]. Real-world examples include Aztec Construction slashing unplanned maintenance by 40%, MidWest Materials reducing overtime by 80%, and the Sanctuary at False Cape saving over $100,000 [11].
How It Works with Predictive Tools like Oxand Simeo™
Predictive platforms like Oxand Simeo™ can significantly improve PMP by converting potential failures into scheduled tasks. What sets Simeo™ apart is its use of a massive database – over 30,000 maintenance laws and 10,000 proprietary aging models. Instead of relying solely on sensor alerts, it uses probabilistic modeling to predict when assets will need attention [11]. By analyzing equipment usage and performance history, Simeo™ identifies optimal maintenance windows, helping organizations shift from reactive to proactive strategies [22].
When paired with automated scheduling and real-time dashboards, these tools eliminate manual data entry errors and ensure consistent PMP tracking across all assets. This streamlined process supports smarter, risk-based decision-making [22].
How It Helps with Risk-Based Planning Decisions
Just like MTBF (Mean Time Between Failures) and OEE (Overall Equipment Effectiveness), PMP provides early warnings that can refine maintenance strategies. It quantifies the balance between proactive and reactive efforts, offering insights to improve long-term asset health. A PMP in the range of 80–90% planned maintenance versus 10–20% unplanned maintenance reflects a well-optimized system [16].
For organizations aiming to meet ISO 55001 standards, PMP is crucial for evaluating whether resources are being used wisely or wasted on emergencies. Tracking PMP alongside other KPIs like MTBF and OEE helps justify capital investments and asset replacement decisions with data rather than assumptions [22]. This is particularly valuable when weighing maintenance costs against Replacement Asset Value (RAV) to determine whether repairing or replacing an asset makes more sense.
5. Preventive Maintenance Compliance
Why This KPI Matters for Predictive Maintenance
Preventive Maintenance Compliance measures how often scheduled preventive maintenance (PM) tasks are completed on time. In simpler terms, it tracks whether maintenance happens when it’s supposed to. The gold standard for this metric is 90% or higher [21]. Falling below this mark signals a problem – necessary upkeep is being skipped, which puts assets at risk [17].
When compliance is high, it serves as a warning system for potential issues. It helps prevent unplanned breakdowns by ensuring tasks are done before problems arise. On the flip side, missing scheduled maintenance often leads to costly emergencies and unexpected failures [21]. This proactive approach is essential for keeping costs in check and maintaining smooth operations.
How It Affects Asset Lifecycle Costs
Unplanned equipment failures can be incredibly expensive, costing around $25,000 per hour [13]. Preventive maintenance, on the other hand, can save 12–18% in costs by addressing problems early – before minor issues snowball into major repairs [21][22].
"Late maintenance tasks defeat the purpose of preventive maintenance by allowing equipment conditions to deteriorate beyond optimal intervention windows." – Cryotos [22]
The ideal balance for maintenance operations is 80–90% planned tasks versus just 10–20% unplanned work [7]. Achieving this balance keeps overall maintenance costs manageable and extends the life of assets, delaying the need for expensive replacements.
How It Works with Predictive Tools like Oxand Simeo™
Tracking compliance lays the groundwork for predictive maintenance tools. When routine tasks like lubrication, cleaning, and inspections are done on time, platforms such as Oxand Simeo™ can focus on spotting real anomalies instead of flagging issues caused by neglect [8]. This reliable data improves the accuracy of predictive insights.
Oxand Simeo™ uses a vast database of over 30,000 maintenance rules and 10,000 aging models to generate actionable recommendations [22]. When integrated with a CMMS, it automates work orders and provides real-time compliance dashboards, ensuring that predictive insights lead to timely maintenance actions.
How It Helps with Risk-Based Planning Decisions
Compliance data plays a key role in making smarter, risk-based decisions. It helps differentiate between assets that fail due to poor upkeep and those that are simply nearing the end of their lifespan [11][16]. For example, if an asset consistently maintains 100% compliance but still breaks down frequently, it’s likely time to consider replacing it.
Organizations that rely on data-driven KPIs like compliance tracking are three times more likely to improve decision-making significantly [8]. When combined with metrics like MTBF and PMP, strong compliance supports ISO 55001 standards by proving that resources are being used wisely, not wasted on emergency repairs [22]. This approach ensures smarter budget allocation and justifies investments in predictive maintenance, reinforcing the importance of risk-based asset planning.
6. Maintenance Schedule Compliance
Why This KPI Matters for Predictive Maintenance
Maintenance Schedule Compliance tracks the percentage of planned maintenance tasks completed within their scheduled timeframes [22][21]. The formula is simple: (Work Orders Completed On Time ÷ Total Scheduled Work Orders) × 100. For organizations aiming for top-tier performance, the benchmark is 90% or higher [21].
This metric serves as a leading indicator, helping predict the likelihood of unplanned equipment failures and downtime [21]. Unlike metrics that focus solely on the condition of machinery, schedule compliance sheds light on the efficiency of maintenance workflows, helping to spot bottlenecks and inefficiencies [3]. Delays in maintenance can speed up asset wear and tear, leading to higher repair costs [22]. Much like Planned Maintenance Percentage (PMP), this KPI signals when it’s time to adjust maintenance strategies.
How It Affects Asset Lifecycle Costs
Falling behind on scheduled maintenance can drive up expenses. Take Aztec Construction, for example. In May 2025, they managed to cut unplanned maintenance tasks by 40% after fine-tuning their scheduling and tracking processes [11]. Similarly, Rite Aid achieved a 90% on-time completion rate by adopting advanced maintenance management tools [11].
Another success story comes from MidWest Materials, an ISO 9001:2015 certified steel service center. By implementing automated preventive maintenance scheduling, they reduced overtime labor by 80%, while also minimizing emergency repairs [11]. These examples highlight how sticking to a maintenance schedule can lead to both cost savings and improved asset performance.
How It Works with Predictive Tools like Oxand Simeo™
This KPI aligns seamlessly with predictive maintenance tools, reinforcing a proactive approach. Predictive platforms help identify potential failures before they happen, cutting down on the reactive work that often disrupts schedules [17][12]. Tools like Oxand Simeo™ rely on historical and real-time data to refine job plans, making them more achievable and easier to follow [17].
Oxand Simeo™ stands out by utilizing over 30,000 maintenance rules and 10,000 aging models to prioritize tasks based on actual asset health and risk, rather than arbitrary calendar dates [18][3]. This ensures that compliance efforts address the most critical tasks first. Additionally, digital dashboards provide instant insights into work order completion rates and schedule gaps, enabling quick adjustments when needed [18][12].
"A schedule with 1,000 hours of work should take 1,000 hours to complete. A big variance here (in either direction) may indicate that you’re using inaccurate job plans." – Prometheus Group [17].
How It Helps with Risk-Based Planning Decisions
Schedule compliance data plays a key role in smarter resource allocation, helping identify which assets need urgent attention and which can wait. For example, if compliance rates are high but man-hour variance is significant, it could signal that job plans are inaccurate or hiding productivity issues [17]. A well-balanced maintenance program typically maintains a ratio of 80-90% planned maintenance to 10-20% unplanned maintenance [16].
"Leading KPIs lead to results; lagging KPIs are the results. If you are managing maintenance without accurate leading and lagging KPIs, then you are lost." – Ricky Smith, UpKeep Expert in Residence [21].
When paired with other metrics like MTBF (Mean Time Between Failures) and PMP, schedule compliance completes the data framework needed for effective risk-based asset planning. It also supports ISO 55001 standards by demonstrating efficient resource use. The real key lies in fostering a culture where technicians feel comfortable reporting why tasks weren’t completed on time – whether due to missing parts, lack of training, or other challenges – rather than simply chasing ideal KPI numbers [21][23].
7. Predicted Time to Failure (PTTF)
Why This KPI Matters for Predictive Maintenance
PTTF predicts when an asset is likely to fail by analyzing its current condition, usage, and historical data. Unlike MTBF, which focuses on past performance, PTTF looks ahead to identify potential risks [3]. This forward-looking insight allows for timely interventions, helping to extend the life of equipment and cut down on costly emergency repairs [3].
By using PTTF, organizations can schedule maintenance at just the right time. This not only maximizes the lifespan of equipment but also prevents disruptions to operations [12]. Companies that adopt predictive maintenance strategies centered around PTTF often see impressive results, with an average return on investment of 8x [3].
How It Affects Asset Lifecycle Costs
PTTF has a direct impact on lifecycle costs by enabling smarter decisions about whether to repair or replace an asset. Knowing how much useful life remains allows organizations to weigh the costs of future repairs against the price of a replacement [16]. This data-driven approach ensures a balanced strategy between repair expenses and replacement investments.
Take Rimex, a tire and rim manufacturer, as an example. By leveraging predictive tools to anticipate failure windows, they reduced equipment downtime by 30% [11]. Similarly, the Sanctuary at False Cape condominium association saved over $100,000 in maintenance costs after adopting predictive maintenance tools [11].
How It Works with Predictive Tools like Oxand Simeo™
Platforms like Oxand Simeo™ enhance PTTF accuracy by using a vast database of over 10,000 aging models and 30,000 maintenance laws, developed through two decades of project experience. Rather than relying entirely on data from IoT sensors, Oxand Simeo™ employs probabilistic modeling to simulate how components age and fail throughout their lifecycle [3]. This makes it possible to predict failure windows even in scenarios where sensor data is limited.
The platform’s automated dashboards provide a clear view of critical PTTF metrics alongside other KPIs, empowering teams to make proactive decisions instead of reacting to emergencies [22][8]. When PTTF highlights an approaching failure, the system can automatically generate work orders and prioritize maintenance schedules to focus on the most urgent assets [22]. This integration strengthens overall asset management strategies, and organizations using such data-driven tools are three times more likely to improve their decision-making processes significantly [8].
How It Helps with Risk-Based Planning Decisions
PTTF also plays a key role in strategic planning, particularly for risk-based capital decisions. By combining PTTF insights with financial metrics like Replacement Asset Value (RAV), asset managers can back their capital expenditure requests with solid data instead of relying on intuition [22][8]. This is especially crucial for aging infrastructure, where tight budgets demand careful prioritization.
To get the most out of PTTF, it’s important to pair it with process metrics like Mean Time to Resolution. For example, if an asset consistently shows a low predicted time between failures, a root cause analysis can help determine whether the team is addressing the underlying issues or just treating symptoms [12][11]. By integrating PTTF with other KPIs, organizations can create a comprehensive framework for risk-based asset planning. This approach not only supports ISO 55001 compliance but also helps maintain the 80–90% planned maintenance ratio that defines top-tier operations [16].
sbb-itb-5be7949
8. Work Order Backlog
Why This KPI Matters for Predictive Maintenance
Work order backlog tracks the total amount of scheduled maintenance work that hasn’t been completed yet, compared to the available labor hours [11]. This metric is key for predictive maintenance because if your team is overwhelmed, predictive alerts lose their effectiveness [16][3]. A growing backlog acts as an early warning for potential asset failures, extended downtime, and production delays [11].
"A growing or consistently large backlog may be an indication that your maintenance operations are not sufficiently meeting your organization’s needs." – Limble CMMS [11]
An increasing backlog highlights inefficiencies and possible understaffing. It can also disrupt schedule compliance [11]. By keeping an eye on the age and importance of pending work orders, you can separate true emergencies from lower-priority tasks, allowing you to focus on urgent predictive alerts [17]. This proactive approach helps manage costs and allocate resources effectively.
How It Affects Asset Lifecycle Costs
From a financial perspective, a high backlog doesn’t just point to inefficiencies – it also increases costs. It creates a cycle where emergency repairs pile up, further delaying scheduled work and causing production slowdowns [11][21]. Ignored tasks often turn into "deferred maintenance", leading to more frequent breakdowns and higher repair expenses over the asset’s lifecycle [11][21]. On the flip side, having no backlog might indicate overstaffing or poor labor utilization [21]. The ideal balance is typically around six weeks of work per technician [21].
For example, MidWest Materials, an ISO 9001:2015 certified steel service center, cut its overtime labor needs by 80% by adopting automated preventive maintenance scheduling, which reduced their backlog [11]. Similarly, Aztec Construction managed to lower its unplanned maintenance workload by 40% by improving its Planned Maintenance Percentage and using digital tools to streamline work order management [11].
How It Works with Predictive Tools like Oxand Simeo™
Platforms like Oxand Simeo™ use backlog data to prioritize and organize maintenance tasks effectively. These tools help managers focus on the most critical overdue tasks by leveraging metrics like Scheduled Maintenance Critical Percent (SMCP) [18]. Automated dashboards highlight performance gaps and separate emergency notifications from routine backlog tasks [18][17]. This ensures that urgent, safety-related tasks are addressed, while less critical work is deferred appropriately.
Organizations that rely on data-driven strategies are three times more likely to improve decision-making [8]. By monitoring the average age of open critical work orders, managers can identify growing delays that signal deeper operational issues [17]. Persistent backlog growth often prompts a root cause analysis to uncover whether the problem stems from staffing shortages, training gaps, or aging assets [11].
How It Helps with Risk-Based Planning Decisions
Backlog data is essential for strategic planning, as it reveals whether your maintenance operations can support a proactive approach. A well-functioning maintenance program typically aims for a ratio of 80-90% planned maintenance to 10-20% unplanned maintenance [16]. If the backlog exceeds six weeks per technician, it’s a sign to reevaluate resource allocation and prioritization methods [21].
A gatekeeping system can validate emergency work orders, preventing non-critical tasks from unnecessarily inflating the backlog [17]. This disciplined approach ensures that predictive maintenance alerts get the attention they need, rather than being overshadowed by routine tasks. Incorporating backlog insights with predictive KPIs creates a balanced, risk-aware maintenance strategy across your assets.
9. Maintenance Cost as Percentage of Replacement Asset Value (RAV)
Why This KPI Matters for Predictive Maintenance
This metric compares annual maintenance spending to an asset’s replacement cost, offering a clear financial benchmark [22]. The formula is straightforward: (Annual Maintenance Cost ÷ RAV) × 100 [22]. Ideally, this percentage should hover around 1% for top-performing systems [21]. If it climbs significantly – especially beyond 10% – it signals either an aging asset or an inefficient maintenance approach [22][24]. This KPI is particularly useful for guiding decisions about whether to repair or replace an asset.
How It Affects Asset Lifecycle Costs
A high RAV percentage often points to excessive reliance on reactive maintenance, which is linked to 3.3 times more downtime and 16 times more defects compared to proactive strategies [9]. Emergency repairs add further strain on budgets, making the asset increasingly costly to maintain.
"Any time you are planning to pump more time and money into a deteriorating asset, it’s important to consider the cost of a replacement instead."
– Sarah Laubach, Content Specialist, FMX [16]
Real-world examples underscore the value of this KPI. For instance, the Sanctuary at False Cape condominiums adopted advanced preventive maintenance tools, cutting over $100,000 in maintenance costs and improving their RAV percentage [11]. Similarly, Ahlstrom achieved a 90% reduction in Mean Time to Repair, dropping from 580 hours per month to just 60 hours. This shift significantly lowered labor-related maintenance expenses [9].
How It Works with Predictive Tools like Oxand Simeo™
Platforms like Oxand Simeo™ provide a deeper analysis of RAV percentages by tracking costs and historical data across portfolios. These tools integrate data from over 30,000 maintenance laws and 10,000 proprietary aging models to predict future maintenance needs based on factors like equipment age, usage, and failure history [22]. This foresight helps identify cost trends early, preventing last-minute emergency replacements.
Additionally, the system flags assets approaching the critical 10% RAV threshold. This data is invaluable when making a case to leadership for capital replacement investments [22][24]. By shifting from reactive to strategic planning, organizations can better allocate resources and avoid costly surprises.
How It Helps with Risk-Based Planning Decisions
A rising RAV percentage doesn’t just strain budgets – it also increases the likelihood of catastrophic asset failures [17][18]. Effective maintenance programs aim for 80–90% planned work versus only 10–20% unplanned repairs [16]. If your RAV percentage is high, it’s a sign that resources are being drained by unplanned, reactive maintenance.
To make smarter repair-versus-replace decisions, use this calculation: divide the cost of a new asset by its expected lifespan, then add the projected annual maintenance cost [16]. For example, if maintaining an old unit costs $200 annually, but replacing it for $1,000 would result in just $100 in annual maintenance over 15 years (about $166.67 per year), replacement is the more economical choice [16]. This kind of analysis ensures your investments balance cost efficiency with risk reduction, keeping your portfolio healthy and sustainable.
10. Asset Utilization Rate
Why This KPI Matters for Predictive Maintenance
The Asset Utilization Rate shows how effectively your equipment operates compared to its maximum potential. The formula is straightforward: (Actual Output ÷ Potential Output) × 100 [11]. This metric quickly highlights whether critical assets are underperforming due to inefficiencies or nearing the end of their lifespan [11]. A high utilization rate indicates that equipment is performing close to its full capacity [11]. Predictive maintenance tools play a key role here, helping to identify potential failures before they occur, which keeps downtime to a minimum and improves operational efficiency [22]. This, in turn, has a direct impact on reducing asset lifecycle costs.
How It Affects Asset Lifecycle Costs
Low utilization rates can hurt your return on investment (ROI) and signal that assets aren’t delivering as expected. Unplanned equipment failures are particularly costly, with downtime averaging $25,000 per hour [13]. These emergency breakdowns not only disrupt operations but also drag down utilization rates, increasing costs further. Top-performing facilities aim for an overall equipment effectiveness (OEE) of 85% or higher, yet many operations only reach 60–65% [22]. For instance, in May 2025, MidWest Materials – a steel service center certified under ISO 9001:2015 – cut overtime labor by 80% through automated preventive maintenance. This improvement boosted both asset reliability and utilization [11].
How It Works with Predictive Tools like Oxand Simeo™
Predictive platforms like Oxand Simeo™ take utilization tracking to the next level by offering real-time insights into bottlenecks and underperformance [22]. These systems automate data collection and ensure consistent calculations across your portfolio [22]. Leveraging data from over 30,000 maintenance laws and 10,000 proprietary aging models, Oxand Simeo™ predicts equipment failures and schedules maintenance at the most strategic times, maximizing uptime and utilization [22]. When utilization rates dip below target levels, the platform triggers alerts for a Root Cause Analysis to identify whether the issue stems from inefficiencies, operational errors, or equipment wear and tear [10][13]. It also tracks trends in declining utilization and rising maintenance costs, flagging assets that may be nearing the end of their useful life [10].
How It Helps with Risk-Based Planning Decisions
Asset Utilization Rate is invaluable when deciding whether to repair or replace equipment. A steady drop in utilization paired with rising maintenance costs often signals that continued repairs may no longer be cost-effective [7][13]. A common rule of thumb: if annual maintenance costs exceed 10% of an asset’s replacement value, replacing the equipment may be the smarter financial choice [13]. By tracking utilization alongside metrics like maintenance cost as a percentage of replacement asset value (RAV), you can make more informed investment decisions. Pair this KPI with others like MTBF (Mean Time Between Failures) and OEE for a complete picture of equipment reliability [8]. Focus on mission-critical assets where failures would have the greatest impact [21]. By combining utilization data with other key performance indicators, asset managers can make smarter, risk-based decisions that improve portfolio performance.
"If you can’t measure it, you can’t manage it" [13].
What Are Key Performance Indicators For PdM Objectives?
Using KPIs Together for Better Planning
When you combine individual KPI insights, you get a more complete picture of asset performance. While single KPIs provide snapshots, integrating them reveals the overall health of your assets. For example, pairing historical metrics like MTBF (Mean Time Between Failures) and MTTR (Mean Time to Repair) with process metrics such as Mean Time to Resolution offers a balanced view. This approach evaluates both the condition of your assets and the efficiency of your maintenance processes, helping to maximize ROI.
"Combining maintenance KPIs that reflect machine health with those that monitor the health of your maintenance process is your ticket to fastest, highest ROI." – AssetWatch [3]
This comprehensive perspective is further enhanced by using digital dashboards for smarter, risk-based decision-making. Tools like Oxand Simeo™ consolidate scattered data across your portfolio into one unified view. This allows for quick identification of performance gaps and clearer investment prioritization. The platform uses an extensive maintenance database to simulate asset degradation under different scenarios. These simulations let you compare the outcomes of extending an asset’s life through maintenance versus replacing it, while also considering factors like risk, energy efficiency, and carbon reduction goals. By incorporating these variables, you can protect both asset performance and investment value.
Integrated software solutions often lead to significant cost savings, cutting maintenance budgets by 10–20%, with some clients achieving up to a 30% reduction in total ownership costs [1][2][5]. Many see measurable results within just 6–12 weeks [1][2]. Dashboards also simplify complex data, making it easier for non-technical stakeholders to understand and use. This clarity strengthens budget justifications and supports strategic decision-making [4]. By communicating these insights effectively, decision-makers can confidently align maintenance spending with broader strategic goals. Using integrated KPI analysis is key to risk-based asset investment planning, ensuring a proactive, data-driven approach to asset management.
Conclusion
Keeping an eye on predictive maintenance KPIs can completely change how assets are managed. Instead of reacting to problems as they arise, organizations can shift to a more strategic, data-driven approach. This not only cuts costs but also extends the lifespan of equipment and boosts overall performance. Companies that embrace predictive asset management tools can see a noticeable decrease in their total cost of ownership [1][2].
The real value lies in how these KPIs work together. For instance, tracking metrics like MTBF alongside PTTF, or combining OEE with maintenance costs as a percentage of RAV, provides a clearer picture. These insights help businesses make smarter investment choices, prioritize capital and operational expenditures, and even align with sustainability goals such as reducing CO₂ emissions [1].
By integrating data analysis, aging models, and risk forecasting, predictive asset management ensures maintenance is planned at the right time, avoiding unnecessary interventions.
"Predictive asset management uses data analysis, ageing models and risk forecasting to determine when interventions should be planned. It enables better investment decisions, extends asset life, reduces lifecycle costs and creates more reliable, ROI-focused investment plans." – Oxand [1]
Tools like Oxand Simeo™ bring all these KPIs together into intuitive dashboards. These dashboards transform complex datasets into actionable investment strategies, using historical data to simulate how assets might degrade under different conditions [5].
As highlighted throughout this article, start by monitoring these 10 KPIs for your key assets. The data not only supports investment decisions but also minimizes unexpected downtime and promotes long-term asset health. With the right tools and metrics in place, you’ll create assets that are not only efficient today but also sustainable for the generations to come.
FAQs
How do predictive maintenance KPIs help improve asset reliability?
Predictive maintenance KPIs are essential for keeping assets running smoothly by offering early alerts about potential problems. These metrics help you tackle issues before they grow, allowing for timely and focused actions that cut down on unexpected downtime.
Monitoring these KPIs empowers asset managers to boost performance, maintain steady uptime, and prolong the life of key equipment. This forward-thinking strategy not only reduces interruptions but also improves planning and resource management, ensuring operations run more reliably and efficiently.
How does Oxand Simeo™ support predictive maintenance?
Oxand Simeo™ is a cutting-edge solution designed to help asset managers anticipate maintenance needs by predicting when equipment or infrastructure might fail. By leveraging decades of lifecycle data and running advanced simulations, Simeo™ makes it possible to schedule repairs and replacements proactively. This approach not only helps prevent unexpected breakdowns but also extends the lifespan of assets.
What sets Simeo™ apart is its ability to process thousands of regulations and performance metrics to generate maintenance plans that align with specific goals – whether focused on cost, risk, or sustainability. The results speak for themselves: 10–20% savings on maintenance costs, up to 70% fewer failures, and 20–40% longer asset lifespans. Plus, it contributes to energy efficiency and supports sustainability efforts, making it a comprehensive tool for modern asset management.
Why is it important to track Maintenance Cost as a Percentage of Replacement Asset Value?
Tracking Maintenance Cost as a Percentage of Replacement Asset Value (RAV) is a smart way to assess whether you’re spending wisely on your assets. When maintenance costs start nearing – or even surpass – the asset’s replacement value, it’s a clear sign to weigh the long-term benefits of repairing versus replacing.
This metric plays a key role in smarter budgeting and resource planning. It helps asset managers steer clear of overspending on outdated or underperforming equipment. Keeping an eye on this KPI ensures you safeguard your return on investment (ROI) and stick to a practical, efficient maintenance strategy.
Related Blog Posts
- Predictive vs Reactive Maintenance: Cost Analysis Guide
- Predictive Maintenance for Asset Management (Infrastructure and Real Estate) is critical – use the web site the web site:https://theiam.org
- Predictive Maintenance & ROI
- How to Calculate the Real ROI of Predictive Maintenance (and Feed It into Your Investment Plan)