


Want to make your investments count for the climate? Carbon-aligned investment planning is all about prioritizing projects based on how much CO₂ they reduce for every dollar spent. It’s a practical way to meet decarbonization goals while maximizing financial efficiency.
Here’s the core idea:
- Measure CO₂ reductions per dollar invested using metrics like "cost per ton of CO₂ avoided."
- Focus on projects with the highest climate impact for the lowest cost.
- Use tools like Oxand Simeo™ to consolidate data, forecast outcomes, and optimize investment decisions.
Why does it matter? The real estate and infrastructure sectors account for 37% of energy-related CO₂ emissions globally. With tight budgets and rising ESG expectations, companies must prioritize projects that deliver the best return on both financial and climate fronts.
How it works:
- Build a detailed asset inventory to assess baseline emissions.
- Calculate CO₂ reduction potential for each project.
- Standardize costs to ensure fair comparisons.
- Use metrics like Net Cost per Tonne and CO₂ per Dollar to rank investments.
- Create multi-year plans and monitor progress regularly.
This approach not only helps organizations meet climate targets but also aligns with financial goals, regulatory frameworks, and ESG funding opportunities.
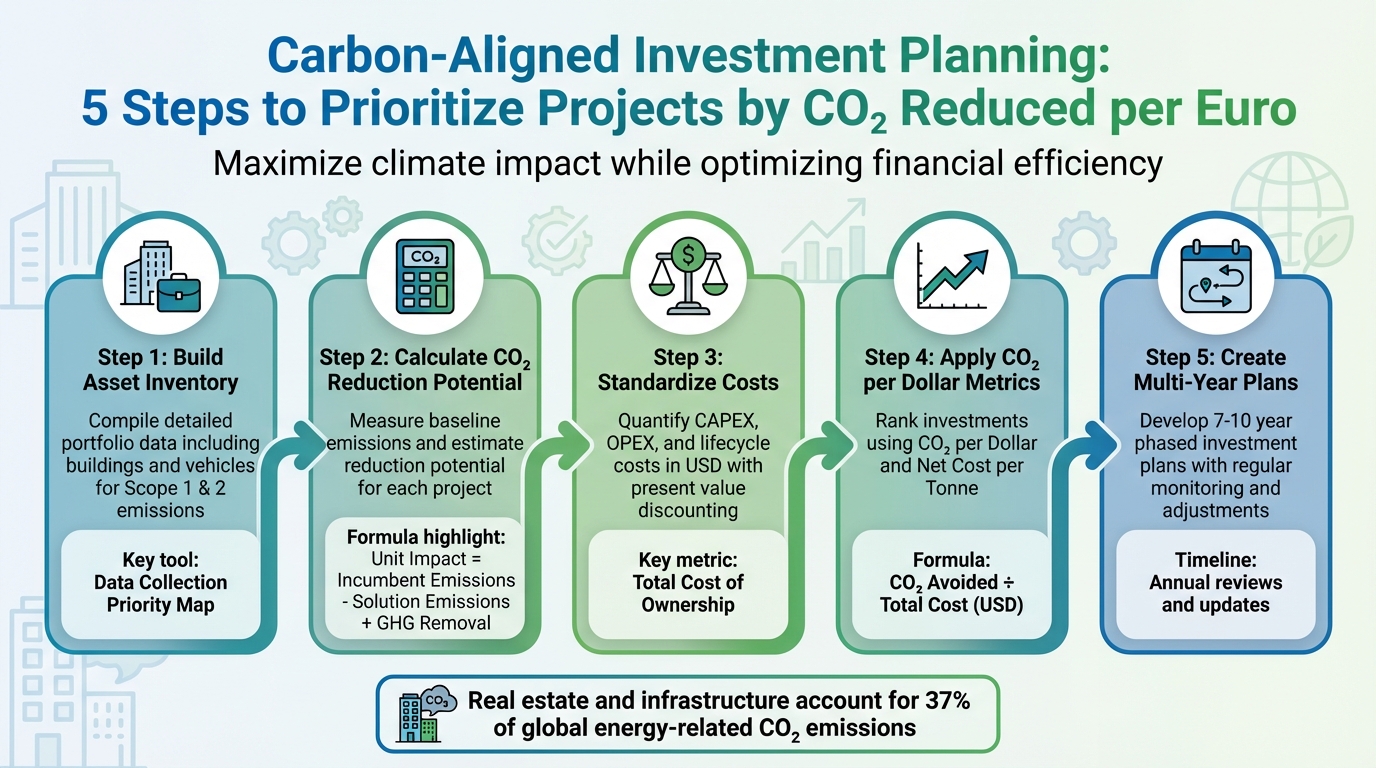
5-Step Carbon-Aligned Investment Planning Framework
COP28: Launch of the GCF-NDC Partnership Joint Climate Investment Planning & Mobilization Work
Preparing Data and Assumptions for CO₂ per Dollar Analysis
To calculate CO₂ reduction per dollar effectively, you need solid, dependable data. Without it, even the most advanced formulas will lead to flawed conclusions. There are three key steps to focus on: creating a thorough asset inventory, estimating baseline emissions and potential reductions, and ensuring project costs are standardized for fair comparisons.
Building a Portfolio-Wide Asset Inventory
Start by compiling a detailed inventory that includes everything in your portfolio – both buildings and vehicles – to account for Scope 1 and 2 emissions [1]. Define the scope of your portfolio clearly. This could include office spaces, warehouses, data centers, or transportation assets. Tools like the U.S. Department of Energy’s Data Collection Short and Long Forms can help ensure consistency in recording asset details [3].
Focus on critical asset features like HVAC systems, building envelopes, and lighting by using a Data Collection Priority Map. For large portfolios, tools like QBAT can help with initial high-level assessments before diving into detailed data collection [3]. Software such as Oxand Simeo™ simplifies the process by consolidating scattered data into a single dashboard, categorizing assets by type, HVAC systems, and controls.
"The process described in this framework helps organizations develop an actionable plan that prioritizes emissions reduction measures, identifies solutions, and lays out a phased pathway to achieve deep emissions reductions."
– LBL Framework [1]
Make sure your inventory aligns with local regulations, such as NYC LL87 or DC BEPS templates, so it supports both internal planning and compliance needs [3].
Once your inventory is in place, the next step is calculating baseline emissions and assessing reduction potential.
Estimating Baseline Emissions and Reduction Potential
With a complete inventory, you can calculate baseline emissions for each asset or project. The Unit Impact Calculation is the cornerstone here – it measures the emissions difference between the current system (baseline) and the proposed alternative [4]. For example, if you’re replacing a gas boiler with a heat pump, compare the CO₂ emissions per BTU of heating produced by each system.
Decide whether to use a static baseline, which assumes current conditions remain constant, or a dynamic baseline, which accounts for changing factors over time [5]. For emissions beyond CO₂, apply Global Warming Potential (GWP) factors based on IPCC guidance. For instance, methane from fossil fuels has a GWP of 82.5 over 20 years and 29.8 over 100 years [4].
Document all your assumptions thoroughly. As Peter Fox-Penner, Chief Impact Officer at Energy Impact Partners, notes:
"It is only through the most accurate reporting possible can we serve the ultimate purpose of allocating capital to investments with the highest real impact" [4].
The final step is standardizing cost data to ensure investment comparisons are fair and accurate.
Standardizing Project Cost Data
To compare projects effectively, quantify costs consistently, including upfront costs (CAPEX), operational savings (OPEX), and total lifecycle expenses. The NIST Life Cycle Costing Manual (Handbook 135) provides a structured approach to calculating the total cost of ownership, covering factors like energy and water conservation [6]. All costs should be expressed in USD and discounted to present value.
For example, consider a rooftop solar system costing $150,000 upfront but saving $12,000 annually in electricity over 25 years. Those future savings need to be discounted to their present value using an appropriate rate. It’s also crucial to standardize the "solution unit" – like one MWh of energy generated or one vehicle mile traveled – so that comparisons between existing technologies and alternatives are meaningful [4].
"Economic data alone cannot reveal the full return potential of any given investment. As climate impact becomes increasingly acknowledged as a value driver… shared measurement and management instruments are needed to accelerate change."
– Daniel Valenzuela, Head of IR & Impact, World Fund [4]
Tools like Oxand Simeo™ can streamline this process by applying consistent cost models and present-value calculations across your portfolio, saving time and ensuring accuracy.
Calculating CO₂ Reduced per Dollar
Understanding carbon efficiency boils down to a simple question: how much CO₂ can you avoid for every dollar spent? This metric is incredibly useful for comparing projects that may differ in size, scope, or technology.
The Core Formula
To calculate carbon efficiency, divide the total lifetime CO₂ avoided by the project’s total cost (in USD) [7]. For instance, if a heat pump retrofit costs $50,000 and avoids 150 metric tons of CO₂ over 20 years, the result is 0.003 metric tons per dollar – or about $333 per metric ton avoided.
Another key calculation is Unit Impact, which measures the emissions difference between the current solution and the alternative. Here’s the formula:
Unit Impact = Incumbent Unit Emissions – Solution Unit Emissions + Solution Unit GHG Removal [4].
Multiply this by the total lifespan or number of units to determine the total greenhouse gas (GHG) savings over time. To refine this further, calculate the Net Cost per Tonne by factoring in economic benefits like fuel savings or increased tax revenue. For example, the Sacramento Area Council of Governments (SACOG) applied this approach in a transit study. Their $120 million annual investment in transit resulted in $380 million in yearly fuel savings, creating a net benefit of -$198 per ton saved. Similarly, Portland’s bicycle infrastructure achieved a net cost of -$1,664 per metric ton of CO₂, thanks to additional benefits.
Finally, adjust these calculations to account for the timing of costs and the lifespan of projects.
Accounting for Time Value and Project Lifetimes
Projects vary in lifespan, and the value of money changes over time – $1 today is worth more than $1 in the future. To compare projects fairly, convert all costs into present value terms using Net Present Value (NPV) [7]. This ensures that both financial returns and carbon savings are evaluated consistently.
For carbon metrics, focus on lifetime emissions reductions – the total CO₂ avoided over the project’s operational life – rather than annual figures [8]. When calculating costs, use grant-equivalent terms if the financing structure includes grants or concessional loans [8]. Tools like Oxand Simeo™ can handle these calculations, streamlining the process and reducing errors.
Comparing CO₂ Metrics with Financial Metrics
While CO₂ per dollar is a powerful tool for prioritizing projects, it works best alongside traditional financial metrics. The table below highlights how these metrics complement each other:
| Metric | Focus | Use Case |
|---|---|---|
| CO₂ per Dollar | Carbon Efficiency | Prioritizing projects within a fixed carbon budget or climate fund. |
| Net Present Value (NPV) | Financial Return | Assessing long-term investment profitability. |
| Internal Rate of Return (IRR) | Profitability Threshold | Evaluating the speed of financial return relative to a hurdle rate. |
| Payback Period | Liquidity/Risk | Measuring how quickly the initial investment is recovered. |
| Net Cost per Tonne | Societal ROI | Balancing carbon savings with economic co-benefits (e.g., fuel or health savings). |
By combining carbon metrics with financial measures, you can develop a more comprehensive investment strategy. Many organizations are already incorporating these metrics into their decision-making processes. For example, some lower IRR thresholds for projects with high decarbonization potential, while others use internal carbon pricing (ICP) to make carbon-efficient projects more attractive [9]. Repsol, for instance, pledged in 2024 to allocate 45% of its capital expenditure to renewable energy over five years, aligning its portfolio with net-zero objectives [9].
"A narrow focus on the dollar-per-tonne of an investment in GHG reduction can exclude important GHG emissions and miss the bigger economic picture."
– Steve Winkelman, Founder, Green Resilience Strategies [7]
When evaluating projects, think about both the cost of action (what you’ll spend) and the cost of inaction (potential penalties, lost revenue, or missed opportunities) [9]. This dual perspective strengthens the case for carbon-aligned investments, especially when financial returns extend beyond the typical 2–3 year horizon. It’s a practical framework for creating a well-rounded prioritization strategy.
sbb-itb-5be7949
Building a Prioritization Framework
Once you’ve calculated CO₂ emissions per dollar, the next step is to create a framework that ranks investments across your portfolio. This framework helps turn raw metrics into clear, strategic actions. By combining carbon data with other key factors – such as financial returns, risk exposure, regulatory requirements, and operational preparedness – you can craft a plan that’s both practical and defensible. Essentially, it bridges the gap between analysis and action, ensuring your priorities align with both environmental and business goals.
Setting Decarbonization Targets and Thresholds
Start by establishing portfolio-wide decarbonization targets that align with science-backed pathways. For example, you might use a 2019 baseline and aim for a 50% reduction in emissions by 2030, with interim milestones every five years [12]. To ensure cost-effectiveness, set thresholds for the maximum spending allowed per metric ton of CO₂ avoided. This helps weed out projects that are too expensive for their carbon impact. A dashboard approach works well here, tracking multiple metrics at once, including:
- Absolute financed emissions: Total metric tons of CO₂e.
- Economic emissions intensity: Metric tons of CO₂e per $1 million invested.
- Weighted Average Carbon Intensity (WACI): A measure of emissions intensity across your portfolio [12].
Including Risk and Transition Readiness
Focusing solely on carbon efficiency doesn’t provide the full picture. Your framework should also factor in physical risks (like damage from extreme weather), transition risks (such as policy changes or carbon taxes), and other non-carbon criteria, including asset importance, safety, and regulatory compliance [11]. For example, a project that ensures a critical facility remains operational or avoids hefty regulatory fines may take precedence over a more carbon-efficient option.
"Companies with higher climate risks tend to have lower stock prices but higher returns, reflecting their risk exposure." – Robert F. Engle, Professor Emeritus of Finance, New York University [11]
Before finalizing your priorities, simulate implementation sequences to find opportunities for combining actions or avoiding unintended consequences [10].
Using Scenario Simulation for Optimization
Investment planning rarely follows a straight path. Budgets shift, regulations evolve, and new risks surface. That’s why scenario simulation is so valuable. This approach lets you test various budget, risk, and CO₂ scenarios side by side, projecting outcomes over a period of 5–30 years. For instance, you can model how budget cuts or new regulatory costs might impact your portfolio. Attribution analysis can further break down emissions changes into four categories:
- Operational improvements: Reducing emissions through efficiency measures.
- Portfolio composition: Buying or selling assets to adjust the emissions profile.
- Financial shifts: Changes in revenue or asset valuation.
- Data quality updates: Refining or updating emissions data [12].
This detailed view makes it easier to assess whether you’re genuinely reducing emissions or just shifting numbers around.
If your plan exceeds the budget, prioritize cost-effective, high-impact projects to build momentum [10]. Simulations can also help you sequence actions to maximize "protection-per-dollar", focusing on projects that safeguard the most assets or mitigate the highest risks at the lowest cost [10]. These insights will guide the creation of a multi-year investment plan that’s both actionable and efficient.
Implementing and Maintaining Investment Plans
Converting Priorities into Multi-Year Plans
Once projects have been ranked by CO₂ reduced per dollar, the next step is to organize them into a phased investment plan that aligns with your CAPEX and OPEX cycles, typically spanning 7–10 years [13]. Using previously established decarbonization targets as a foundation, it’s important to differentiate between "Potential Impact" (long-term, top-down scenarios for 2040–2050) and "Planned Impact" (specific, bottom-up forecasts tied to actual business plans) [13]. For example, when replacing aging HVAC systems, consider the "fleet effects" – the emissions reductions tied to the total number of operational units, not just the annual installations [4]. This ensures your multi-year plan captures both short-term wins and sustained, long-term reductions.
It’s also critical to incorporate supply chain factors early in the planning process. Siemens Energy, for instance, requires its suppliers to commit to CO₂ reduction measures with their subcontractors, embedding decarbonization directly into procurement decisions [14]. By aligning projects with business cycles and factoring in supply chain impacts, you create a plan that’s practical, financially sound, and operationally achievable.
With the plan structured, the next step is to monitor progress and make adjustments as needed.
Monitoring and Adjusting the Plan
To keep investment plans relevant, they need regular updates that reflect changing targets, budgets, and real-world outcomes. Track "Realized Impact" – the actual emissions reductions achieved – and compare this with your initial "Planned Impact" projections [5]. Documenting baseline assumptions and lifecycle phases is crucial for updating models with new data [4]. For instance, if a lighting retrofit achieves 30% energy savings instead of the projected 25%, updating your model ensures future projections are more accurate. These updates feed into the prioritization framework, ensuring the plan stays aligned with both original carbon efficiency goals and changing conditions.
"It is only through the most accurate reporting possible can we serve the ultimate purpose of allocating capital to investments with the highest real impact." – Peter Fox-Penner, Chief Impact Officer, Energy Impact Partners [4]
Annual reviews are essential for tracking progress and adjusting priorities. These recurring "Due Diligence Assessments" help monitor carbon management data, evaluate supplier performance, and refine purchasing decisions based on actual results [14]. For projects involving methane, it’s useful to model scenarios using GWP20 (20-year horizon) alongside the standard GWP100. This is because fossil-origin methane has a GWP20 of 82.5 compared to a GWP100 of 29.8, making its short-term climate impact far more severe [4]. Using this dual-horizon approach ensures your plan addresses both immediate and long-term climate challenges.
U.S.-Specific Considerations
Once your multi-year plan is in place and under regular review, it’s important to navigate the regulatory landscape unique to the U.S. market. Investment plans must account for varying federal, state, and local regulations. For example, aligning with federal programs to achieve Scope 1 and 2 reductions is key [1][15]. At the regional level, building owners are increasingly subject to stringent benchmarking requirements, which directly influence asset values and compliance costs [16]. Considering that the built environment contributes roughly 40% of global CO₂ emissions, with building operations responsible for 27%, carbon performance now directly impacts financial metrics [16].
"The value of your asset will very soon include its carbon expenditure." – ABM Engineering+ [16]
When reporting, it’s essential to align metrics with the WRI/WBCSD GHG Protocol for Scope 1, 2, and 3 emissions. Use established frameworks to set and disclose net-zero targets [4][14]. For portfolios with significant methane exposure, the shift toward GWP20 metrics highlights the urgency of addressing near-term climate impacts [4]. By harmonizing federal, state, and local requirements and standardizing your approach across the portfolio, you ensure your investment plan remains compliant, credible, and aligned with both regulatory expectations and market demands.
Conclusion
Carbon-aligned investment planning empowers asset owners to make smarter financial decisions while working toward sustainability goals. By measuring CO₂ reductions per dollar, setting science-based targets, and using scenario simulations, organizations can allocate resources to projects that deliver the greatest climate benefits. This approach not only ensures regulatory compliance but also safeguards long-term asset value, aligning portfolios with the demands of a low-carbon economy where carbon efficiency increasingly impacts financial performance.
This methodology provides a structured, data-driven roadmap – from assessing assets to running scenario simulations – ensuring every decision is backed by reliable data and a transparent process. Hugh Garnett, Investor Strategies Senior Specialist at IIGCC, emphasizes its importance:
"Integrating WLC into decarbonisation strategies can help not only to mitigate environmental impact but also protect the long-term resilience and value of those real estate assets" [17].
The growing emphasis on sustainability metrics and ESG-focused funding highlights the financial advantages of carbon-efficient investments. Companies adopting this strategy can potentially lower capital costs by around 10% and improve their market competitiveness, especially as science-based targets become a key driver in decision-making [2].
Oxand Simeo™ supports this forward-thinking approach by embedding carbon costs into financial evaluations and running detailed scenario simulations across various climate pathways. With access to over 10,000 proprietary aging models and 30,000+ maintenance rules, the platform enables organizations to forecast asset performance, track emissions reductions, and prioritize investments that maximize both financial returns and CO₂ savings.
FAQs
How can I calculate the CO₂ reduction per dollar spent on my investment projects?
To figure out the CO₂ reduction per dollar spent, start by identifying your project’s baseline emissions – the greenhouse gas emissions that would occur without making any changes. Then, estimate the post-project emissions after implementing your planned upgrades, such as adopting renewable energy or improving energy efficiency. Subtract the post-project emissions from the baseline emissions to calculate the total CO₂ reduction, measured in metric tons.
From there, determine the cost-effectiveness by dividing the total CO₂ reduction by the total investment cost in USD. This will show how much CO₂ is avoided for every dollar spent. If you want a more detailed perspective, you can assign a monetary value to the reduction using a carbon price (e.g., dollars per ton of CO₂). This approach provides insight into both the financial and environmental benefits of your project.
This method helps you evaluate and prioritize projects by highlighting those that achieve the greatest carbon reduction for your investment, making it easier to align your efforts with both sustainability goals and budgetary constraints.
How can I prepare data for analyzing CO₂ reductions per dollar spent?
To get started with a CO₂-per-dollar analysis, the first step is to define the project’s scope. This means setting clear geographic and time boundaries, identifying the life-cycle stages involved (like construction, operation, or end-of-life), and establishing a baseline scenario to measure reductions against. Once the scope is clear, gather consistent activity data. This could include metrics like electricity consumption, fuel usage, material quantities, or mileage. Reliable sources such as utility bills or procurement records are ideal. Make sure all data aligns to a common reporting year, and use the latest region-specific emission factors to convert these activities into CO₂e values. Be sure to document any assumptions or data gaps to maintain transparency.
On the cost side, compile a detailed breakdown of the total investment. This includes capital costs, operations and maintenance (O&M), financing, and any adjustments for carbon pricing. All costs should be expressed in current U.S. dollars and matched to the same timeline as the emissions data. Standardize your datasets, check for completeness, and address any outliers. To calculate the CO₂-per-dollar metric, divide the projected CO₂e reductions (in metric tons) by the total investment. Running sensitivity analyses can be a valuable step to understand how changes in key inputs might influence the results, helping you build a solid and comparable foundation for identifying the most impactful projects.
How do I combine carbon reduction metrics with financial metrics for better investment planning?
To integrate carbon reduction metrics with financial metrics, start by determining the CO₂ emissions for each project throughout its entire lifecycle – covering construction, operation, and end-of-life phases. Next, assign a monetary value to these emissions using a carbon price (for example, $80 per metric ton in 2025 U.S. markets). This step translates emission reductions into a dollar value, which can then be factored into financial analyses like net present value (NPV) or internal rate of return (IRR) as either avoided costs or additional cash inflows.
Include these carbon-adjusted cash flows in your broader business case, ensuring sustainability and ESG considerations are evaluated alongside traditional financial metrics. Additionally, scenario analyses can be conducted to explore how shifts in carbon pricing, incentives, or penalties might affect project returns. This method enables you to focus on investments that achieve the greatest CO₂ reduction per dollar while staying aligned with your sustainability objectives and regulatory demands.
Related Blog Posts
- Achieving Net-Zero in Real Estate Portfolios: From Targets to Investment Plans
- Balancing Risk, Budget and Carbon: A Practical Framework for Capital Planning
- Financing the Green Transition: How to Use Your Investment Plan to Access Sustainable Funding
- Building Multi-Year Investment Scenarios in Days, Not Months