


Are you spending too much on replacing equipment too soon or waiting until it breaks? Asset analytics can help you save money and avoid costly mistakes. By analyzing data like condition scores, maintenance logs, and failure histories, you can make smarter decisions about when to repair, replace, or upgrade assets.
Here’s what you need to know:
- Predictive analytics can reduce unplanned downtime by up to 80% and cut maintenance costs by 5–10%.
- Risk-based models prioritize investments based on actual failure probabilities and consequences, saving up to 60% in capital expenditures.
- Standardized data systems improve accuracy and allow better lifecycle planning.
- Sustainability goals can be integrated into CAPEX decisions, ensuring long-term value.
Companies like UtilityCo and Trenitalia have already saved millions by using these methods. Whether you manage utilities, rail systems, or other infrastructure, the approach is clear: use data to reduce waste, improve reliability, and align spending with your priorities.
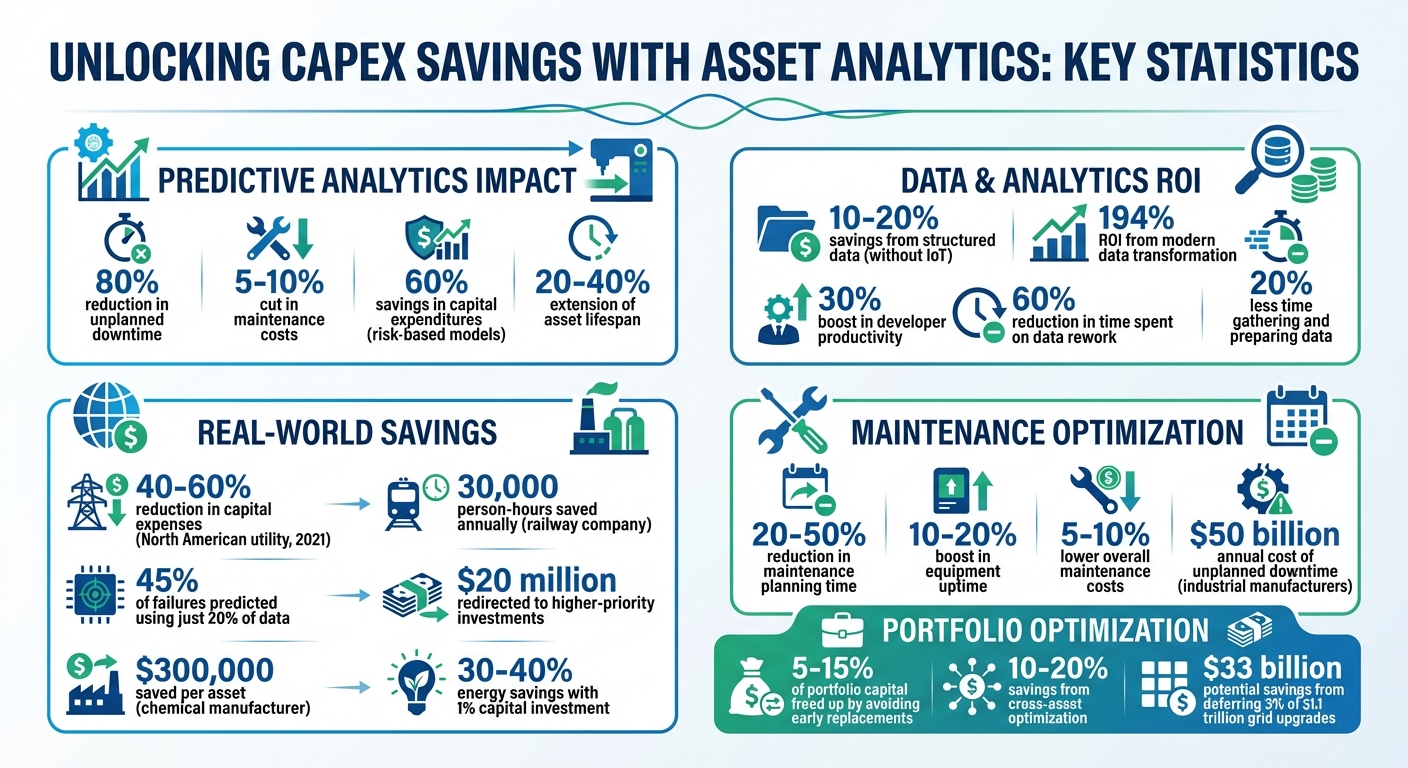
Asset Analytics ROI: Key Statistics for CAPEX Savings and Predictive Maintenance
Case Study: Transforming Capital Planning at SRP
Building a Data Foundation for Asset Analytics
To predict failures and make smarter spending decisions, having clean, centralized data is crucial. Many organizations, however, begin with data scattered across various systems – GIS maps in one corner, work orders in another, and sensor readings elsewhere. This fragmentation makes it tough to prioritize investments effectively.
The solution? Consolidate everything. Gather internal records like installation dates, maintenance logs, and failure histories, and combine them with external data such as weather patterns, seismic activity, and market trends. This creates a unified data warehouse [3][1]. For utilities, this often means integrating systems like Geographic Information Systems (GIS), Outage Management Systems (OMS), and SCADA platforms, which traditionally operate in isolation [3][4]. By bringing all this information together, you build a solid foundation for smarter capital expenditure (CAPEX) decisions.
Data quality is just as important as data centralization. Address issues like missing or duplicate records and make sure the data aligns with your decision-making needs [3][7]. Create a feedback loop where your decision goals inform the kind of data you collect, and then continuously refine its quality to meet those goals [8]. Don’t wait for perfection – start with assets that have "good enough" data to show value, and expand from there.
"Data used must be held to integrity standards determined by the facility asset management system’s decision-making needs." – National Academies of Sciences, Engineering, and Medicine [8]
Centralizing Asset Inventories
Breaking down data silos isn’t just a technical challenge – it’s an organizational one. Success often requires collaboration between IT, operations, and maintenance teams from the very beginning [3][7]. Support from the C-suite can also encourage departments to share data more freely [3][4].
Many organizations set up a Digital Center of Excellence to guide this transformation. This centralized team takes care of technical expertise, develops standardized processes, and ensures consistent training across the company [3]. Cross-functional teams should regularly review progress, co-create solutions, and quickly adapt based on feedback.
Your technical setup should enable real-time monitoring. Equip critical assets with sensors and remote-monitoring tools to feed performance data into your centralized system [4]. Even if you can’t install IoT devices on every asset, leveraging structured data can still deliver savings of 10% to 20% [3] by enabling predictive analytics.
Standardizing Data Collection and Condition Scoring
Inconsistent condition assessments can throw off even the best analytics. For instance, if one inspector rates a pump as "fair" but another calls a similar one "poor", your predictive models won’t have a reliable baseline. The fix is to use standardized scoring systems that everyone adheres to.
A good approach combines two key metrics: a Health Score (likelihood of failure) and a Criticality Score (impact of failure). Health scores pull from internal data like asset age and maintenance history, alongside external factors like weather exposure [3]. Criticality scores factor in repair costs, service disruptions, safety risks, and environmental effects [3]. Together, these scores let you prioritize investments based on actual risk instead of gut feelings.
Shifting from scattered spreadsheets and informal knowledge to a centralized, objective system can dramatically improve decision-making [10][3]. For example, in 2021, a North American utility replaced its outdated "three strikes" cable replacement rule with a machine-learning model built on standardized data. The result? They predicted 45% of failures using just 20% of their data and reduced capital expenses by 40% to 60% [3].
Maintaining Data Quality and Governance
Once your inventories are centralized and standardized, maintaining governance becomes critical. Before scaling analytics across your portfolio, define your data architecture and governance framework [7]. This includes setting clear rules for data ownership, update frequencies, and validation processes.
Your data collection should directly support decision-making. Focus on capturing the details that genuinely influence project prioritization, rather than gathering irrelevant information [9]. Involve subject matter experts early to ensure your data models reflect actual conditions [3]. This structure enables precise, risk-based investment decisions that lead to significant CAPEX savings.
Cloud platforms are becoming the go-to choice over on-premise systems because they offer the scalability and flexibility needed to manage insights from an expanding network of connected assets [7]. As data sharing grows across cloud and third-party networks, robust cybersecurity measures are essential – especially for utilities that must comply with NERC CIP standards [7]. Treat your data like any other critical asset, applying the same level of care and rigor as you would to physical infrastructure.
Converting Data into Investment Priorities
Once you’ve built a strong foundation of reliable data, the next step is turning those insights into smart investment decisions. Centralized and standardized asset data allows you to transform raw numbers into actionable plans. This is where multi-criteria decision frameworks play a key role. These frameworks assess risk as a combination of two factors: the Likelihood of Failure (influenced by factors like condition, age, and operating environment) and the Consequence of Failure (impacting safety, service levels, and costs) [2][3]. By using this approach, you can identify where your capital will have the greatest impact, turning data into prioritized investments.
The ultimate goal is to manage risks while keeping total lifecycle costs as low as possible. Philippe Jetté, Product Manager for Asset Investment Planning at IBM, explains it this way:
"When we talk about minimizing lifecycle costs, we’re including risks as well" [2].
This perspective treats potential end-of-life failures as real costs, helping reduce lifecycle expenses by as much as 20%–40% [11].
Using Multi-Criteria Decision Frameworks
Multi-criteria decision frameworks help balance multiple competing objectives like reliability, safety, regulatory compliance, and even environmental goals [2][4]. For instance, utilities might need to decide whether replacing an aging transformer would reduce customer outages more effectively than upgrading a substation – all while staying within budget and meeting carbon reduction targets. By assigning scores to each factor, analytics platforms can rank assets and recommend actions that deliver the most risk reduction for every dollar spent [2][3].
Scenario modeling becomes critical here. Planners can run "what-if" analyses to see how changes – like a 10% budget cut – might affect long-term costs and risks [2]. This kind of foresight helps justify proactive spending to finance teams and regulators.
Optimizing Capital Allocation Across Assets
Scenario modeling lays the groundwork for optimizing capital allocation across your entire asset portfolio. Analytics allow for cross-asset optimization, helping you determine where the next dollar will have the most impact. Instead of evaluating assets one by one, a unified risk metric enables comparisons across different options – whether it’s replacing a transformer, repairing a bridge, or upgrading a fleet vehicle – to achieve the greatest overall benefit [3].
Optimization engines use algorithms to recommend the best strategies – repair, refurbish, or replace – for thousands of assets at once [2][3]. This approach can identify assets being replaced too early, freeing up 5%–15% of portfolio capital for other priorities [1]. For example, a major railway company used this method to prioritize annual maintenance tasks based on condition data rather than broad standards. This saved over 30,000 person-hours annually and redirected $20 million in engine-overhaul spending to higher-priority capital investments [1]. By uncovering these savings, analytics make it possible to reinvest in projects that offer greater value.
Predictive Maintenance and Lifecycle Planning
After deciding where to allocate resources, the next big hurdle is figuring out the right timing for those investments. Predictive analytics takes maintenance from rigid, calendar-based schedules to a more flexible, condition-based approach. This means you can address issues before they snowball into expensive problems. For context, unplanned downtime costs industrial manufacturers a staggering $50 billion each year [5]. On top of that, using predictive maintenance can extend the lifespan of assets by 20% to 40% [15]. By forecasting component needs, companies can avoid replacing parts too early or dealing with catastrophic failures. Let’s take a closer look at how simulation models play a role in assessing asset deterioration and failure risks.
Simulating Asset Deterioration and Failure
Predictive models rely on a mix of internal data – like sensor readings and maintenance logs – and external factors, such as weather or seismic activity, to calculate metrics like "Health Score" and "Criticality" [12][3]. Machine learning takes this a step further by analyzing historical data to refine predictions [5]. This ongoing process strikes a balance between precision (avoiding unnecessary shutdowns caused by false alarms) and recall (making sure real problems don’t go unnoticed) [6].
For example, a major chemical manufacturer used predictive analytics on extruders and cut unplanned downtime by 80%, saving approximately $300,000 per asset [5].
Coordinating Maintenance with Capital Investment Cycles
The real power of predictive maintenance shines when it’s integrated with long-term capital planning. Instead of treating maintenance and replacement as separate decisions, advanced analytics platforms calculate Total Cost of Ownership (TCO) to determine when replacing an asset is more cost-effective than repairing it [13]. This approach stretches the lifespan of assets, delays replacements, and frees up funds for more critical projects [3].
Adopting predictive maintenance can deliver impressive results: it can reduce maintenance planning time by 20% to 50%, boost equipment uptime by 10% to 20%, and lower overall maintenance costs by 5% to 10% [5]. A good starting point is to pilot this approach on critical assets with sufficient sensor coverage and a documented history of failures. Once you’ve demonstrated the economic benefits, scaling up becomes a logical next step [12][6]. These predictive strategies not only fine-tune maintenance schedules but also guide smarter decisions about capital expenditures.
sbb-itb-5be7949
Aligning CAPEX Planning with Sustainability and Compliance
When you make capital investment decisions today, you’re essentially setting the stage for your emissions profile for decades. Whether it’s new equipment or retrofitting existing assets, these choices directly impact emissions, energy consumption, and even the downstream effects of your products [18]. Much like prioritizing risk and maintenance, weaving sustainability into CAPEX planning is key to ensuring long-term asset value. In fact, the International Energy Agency reported that in 2024, about $2 trillion was invested in low-carbon energy systems [18]. However, despite this progress, only 6% of Fortune 500 companies had set climate targets for 2030 or sooner by 2023, while 33% had longer-term goals [18].
"A company’s capital asset mix is the centerpiece of its current climate performance, and its capital plan – and particularly its CapEx – is the key to understanding a company’s climate future." – Ilmi Granoff, Senior Fellow, Sabin Center for Climate Change Law [18]
Advanced analytics now make it possible to align environmental goals with capital allocation. By comparing different portfolio scenarios – both with and without carbon constraints – these tools help prioritize projects that deliver the most environmental benefit per dollar spent [2][16]. Some platforms even calculate "Carbon Yield", a metric that measures how many metric tons of CO₂ equivalents are avoided per dollar invested, ensuring that investments maximize environmental impact [16].
Addressing these sustainability challenges requires tools that not only evaluate emissions but also model potential carbon reductions.
Modeling Carbon Reduction Scenarios
Physics-based digital twins and dynamic simulations are game-changers when it comes to understanding how retrofits or replacements affect energy and carbon performance [19]. For instance, dynamic simulations have shown that energy savings of 30% to 40% can be achieved with a capital investment of just 1% of an asset’s total value [19].
"Every building is very different. So, to use benchmark values, averages and approximations on an asset level can represent a risk. If you really want accurate data, you need to do dynamic building performance simulation." – Steffen Walvius, Energy & Carbon Lead, Continental Europe, CBRE [19]
Analytics also identify "stranded assets" – those likely to miss future energy or emissions targets – allowing for proactive upgrades before regulatory penalties hit [17]. When assessing the ROI of sustainability-driven projects, some organizations factor in the net present value of future carbon costs, based on expected regulatory pricing [17]. For short-term goals, especially those involving potent greenhouse gases like methane, using 20-year Global Warming Potential (GWP20) factors is more accurate. Methane, for instance, is 86 times more potent than CO₂ over 20 years, offering a clearer picture of its near-term climate impact compared to the standard 100-year metric [16].
While optimizing carbon outcomes is critical, creating thorough documentation ensures compliance and transparency.
Creating Audit-Ready Compliance Documentation
With regulatory standards evolving quickly, organizations need clear, defensible documentation to prove compliance. Asset Investment Planning (AIP) systems help turn sustainability policies into repeatable and auditable processes, linking capital expenditures to business outcomes and stakeholder expectations [2][14].
"A data-driven, long-term AIP process… turns policy into a repeatable, auditable decision process – not a one-off spreadsheet exercise." – Philippe Jetté, Product Manager, IBM [2]
These advanced systems also support compliance with frameworks like "totex" (total expenditure) and RIIO (Revenue = Incentives + Innovation + Outputs), which reward efforts to improve reliability and energy efficiency [14]. They generate reports in regulator-recommended formats, including assessments of physical risks like floods or fires [17]. This kind of audit-ready documentation is invaluable when justifying investment decisions to regulators, boards, or external auditors. And while perfect data isn’t required to get started, organizations can use proxies, like installation dates, and refine their models as more detailed condition data becomes available [2].
Measuring ROI and Expanding Across Portfolios
Once you’ve implemented asset analytics, it’s crucial to showcase its value and systematically expand its use across your portfolio. Building on earlier insights into risk-based asset investment, this approach helps achieve measurable CAPEX efficiencies. Start by tracking key metrics from the very beginning and validating results through pilot projects.
Quantifying Cost Savings and Risk Reduction
To truly understand the return on investment (ROI) from analytics, it’s important to consider both the value created and the hidden costs of poor data. A commonly used formula is: (Data Product Value – Data Downtime) / Data Investment [20][21]. Here’s how it breaks down:
- Data Product Value: Includes cost savings from avoided failures and reduced inventory waste.
- Data Downtime: Refers to periods when missing or inaccurate data delays decisions and lowers productivity [20][21].
Organizations adopting modern data transformation practices have reported a 194% ROI, often breaking even in under six months [22]. Analytics can also drive a 30% boost in developer productivity and cut time spent on data rework by 60% [22]. When analysts spend 20% less time gathering and preparing data, they can focus on making more impactful decisions [22].
Beyond these measurable savings, there are qualitative benefits to track, such as improved trust in data, better regulatory compliance, and faster time-to-value for business initiatives [20][22]. Document every avoided downtime event, noting hours saved and the associated cost per hour [23]. This detailed tracking strengthens the case for expanding analytics to additional asset classes.
Once ROI is clearly established, the next logical step is to scale these analytics across the broader asset portfolio.
Scaling Analytics Across Complex Portfolios
To scale effectively, start with a proof of concept focusing on high-impact assets. Choose assets with reliable data and significant CAPEX implications – like transformers or circuit breakers – to quickly demonstrate value [14][3]. After proving ROI in a pilot, prioritize further deployments based on CAPEX/OpEx impact, time to results, and data quality [3].
"A data‑driven, long‑term AIP [Asset Investment Planning] process… turns policy into a repeatable, auditable decision process – not a one‑off spreadsheet exercise." – Philippe Jetté, Product Manager, Asset Investment Planning, IBM [2]
For a smooth scaling process, establish a Digital Center of Excellence (CoE). This centralized hub of data scientists and engineers ensures consistency across departments or operating companies [3]. The CoE can also standardize processes and manage the talent pipeline to maintain high-quality analytics as you expand [3]. Use ETL processes to integrate siloed data from ERP, SCADA, and GIS systems into a single, unified source [14].
When scaling, model lead assets (like utility poles) before dependent ones (like cross arms) to maintain logical consistency [3]. This sequencing ensures that interdependencies between asset types are accurately reflected in investment plans. Once analytics are scaled, apply a unified risk measurement framework to evaluate the ROI on different asset classes – for instance, comparing transformers to underground cables [3][14]. This cross-asset optimization can unlock 10% to 20% in savings while boosting network reliability and performance [3].
Conclusion
Capital expenditure (CAPEX) savings come from having clean, unified data, focusing on risk-based priorities, and weaving sustainability into decision-making. By transitioning from siloed spreadsheets to a unified data system, organizations can significantly cut CAPEX while maintaining – or even improving – network reliability [3]. Don’t wait for perfect data to get started. Use what you already have, prioritize the critical 20% that drives 80% of performance, and fine-tune your approach over time [2]. This unified strategy paves the way for smarter, risk-based investments.
Risk assessment becomes more precise when calculated as the product of Likelihood of Failure and Consequence of Failure. This method zeroes in on high-risk assets, avoiding premature replacements and costly breakdowns [2][3]. It moves decision-making from gut feelings to data-backed analysis, offering a transparent and repeatable process that accounts for every dollar spent.
Incorporating sustainability into these strategies ensures that investments align with long-term environmental goals. With infrastructure portfolios now managing ten times more assets than two decades ago, data-driven approaches are essential for balancing costs, risks, and environmental considerations [7]. For instance, advanced analytics could save $33 billion by deferring or avoiding just 3% of the $1.1 trillion needed for grid upgrades by 2040 [7].
Start by focusing on high-impact assets and leveraging existing EAM/CMMS and GIS data [2][14]. Establishing a Digital Center of Excellence can help maintain consistency across your portfolio [3]. Together, these steps transform raw asset data into actionable insights, enabling smarter investments that save CAPEX and deliver on the promise of data-driven decision-making.
FAQs
How does predictive analytics help minimize unexpected downtime?
Predictive analytics minimizes unexpected downtime by using real-time data from sensors and equipment to spot early warning signs of potential failures. By catching these issues early, teams can schedule maintenance ahead of time, avoiding sudden breakdowns and keeping operations running smoothly.
This method boosts equipment reliability, extends the lifespan of assets, and ensures resources are used more efficiently – all while saving both time and money.
How can asset data be centralized and standardized for better decision-making?
To bring asset data under one roof and make it consistent, start by setting up a solid data management framework. Clearly outline the types of information you need, like maintenance history, condition assessments, energy consumption, and lifecycle schedules. Ensure every team and location gathers this data in the same way. Use a unified taxonomy and store everything in a single, searchable platform – like a cloud-based system – to simplify access and cut down on manual work.
Pay close attention to data quality. Validate information during collection, stick to consistent units (e.g., inches for dimensions or kilowatts for energy usage), and run regular audits to spot and fix any gaps or errors. Assign clear roles for data ownership, set schedules for updates, and implement access controls to keep the information accurate and secure.
Once your data is centralized and standardized, you can harness analytics tools to uncover trends, predict risks, and guide smarter investment planning. This also allows you to track sustainability metrics effectively. With this system in place, you’ll make better decisions, extend the life of your assets, and unlock measurable cost savings.
How does asset analytics help align CAPEX planning with sustainability goals?
Asset analytics turns maintenance and performance data into practical insights, helping capital planners make risk-aware decisions that align with sustainability goals. By examining elements like asset condition, energy consumption, emissions, and lifecycle impacts, these tools uncover ways to cut waste, extend the lifespan of assets, and reduce embodied carbon. This methodology supports objectives such as achieving carbon neutrality, integrating renewable energy, and adhering to environmental regulations.
Modern analytics tools also enable scenario modeling, allowing planners to compare investment options based on factors like total cost of ownership, reliability, and environmental impact. This ensures that capital investments not only generate financial returns but also deliver measurable environmental improvements, such as lower energy use and reduced emissions. Adopting data-driven strategies equips asset owners to meet ESG standards, improve transparency, and strike a balance between optimal performance and sustainability.