


Spreadsheets are failing large-scale asset investment planning. While Excel works for small portfolios, its limitations – errors, inefficiencies, and lack of scalability – become glaring with portfolios worth billions or thousands of assets. Here’s why organizations are shifting to specialized platforms:
- Error-Prone: 88% of spreadsheets contain mistakes, leading to costly miscalculations like J.P. Morgan’s $6.2 billion loss in 2012.
- Version Chaos: Collaboration becomes messy with scattered files and outdated data.
- No Predictive Tools: Spreadsheets can’t forecast risks or simulate scenarios for long-term planning.
- Fails Sustainability Goals: Tracking emissions and compliance manually leads to inaccuracies and inefficiencies.
- Limited Scalability: Spreadsheets struggle with large datasets, breaking down under the weight of complex portfolios.
Platforms like Oxand Simeo™ address these issues with centralized data, predictive modeling, automation, and audit-ready reporting. They’re designed for large-scale portfolios, helping organizations cut costs, reduce errors, and align with modern demands. For portfolios over $2-3 billion, the switch isn’t just practical – it’s necessary.
Where Spreadsheets Break Down: 5 Critical Limitations
As portfolios expand to hundreds or even thousands of assets, spreadsheets begin to show their flaws. These aren’t just minor inconveniences – they can lead to serious financial risks and operational inefficiencies. These limitations undermine confidence in decision-making and create bottlenecks that hinder progress.
Manual Data Entry Leads to Errors and Data Inconsistencies
Manually entering data into spreadsheets is a recipe for errors. Typos, misplaced entries, and inconsistent formatting can pile up across thousands of cells. Formula mistakes – like using the wrong sign, missing a negative value, or disrupting cell links when moving rows – can render entire models unreliable.
These issues go beyond surface-level problems. Studies show that 15% to 30% of asset records in spreadsheets are "ghost assets" – items that have been retired but remain on the books [8]. These phantom entries inflate costs through overpaid insurance, property taxes, and income taxes. On the flip side, missing assets create blind spots in portfolio valuations.
"All it takes is one incorrect deletion, entry, or formatting in a cell to mess everything up. Bad Excel data can result in unreconciled portfolios, inaccurate performance, incorrect billing calculations, wrong total market value, etc." – Samrat Malakar, Empaxis [6]
The risks aren’t hypothetical. In May 2012, JP Morgan Chase suffered a $3.1 billion trading loss during the "London Whale" incident due to a spreadsheet formula error [5]. Similarly, in 2008, Barclays Capital inadvertently purchased 179 unwanted Lehman Brothers assets because hidden rows in a spreadsheet weren’t deleted before converting it to a PDF [6].
On top of that, Excel has technical limitations. Numbers exceeding 15 digits are truncated, distorting precise calculations [9]. And when spreadsheets hit the 1,048,576 row limit, new data is simply cut off, potentially erasing crucial information [7].
Version Control Chaos and Collaboration Issues
Spreadsheets often exist as scattered files – emailed back and forth, stored on shared drives, or saved on personal desktops. This results in a mess of versions with names like "Portfolio_Analysis_Final_v3_REVISED_John.xlsx." Finding a single, reliable source of truth becomes nearly impossible.
This lack of coordination slows decision-making. Finance teams might use one version while operations teams rely on another. By the time discrepancies are discovered, opportunities may have been missed or budgets allocated based on outdated data. Unlike modern platforms, spreadsheets lack automated audit trails to track who made changes, when, and why.
"The major underlying reason behind this vulnerability is the inherent lack of access control, which makes it easy for anyone – including unauthorized users – to alter either values, formulas, or dependencies without being detected or traced." – FinanSys [7]
Even high-performing organizations struggle with these issues. In March 2024, Williams Formula 1 team principal James Vowles admitted they were attempting to manage 20,000 car parts using Excel, calling the system "impossible to navigate and impossible to update" [4]. For infrastructure portfolios managing thousands of assets over decades, the coordination challenges are even greater.
No Predictive Modeling for Risk-Based Decisions
Spreadsheets offer a static snapshot of current data but can’t simulate future scenarios. This lack of predictive capabilities makes it difficult to assess how assets will age, deteriorate, or perform under different investment strategies. Without these tools, decisions often rely more on intuition than on reliable forecasting.
Effective planning requires understanding how deferred maintenance today could lead to costly failures tomorrow or how budget allocations will impact performance over time. Spreadsheets can’t model these complex relationships or run "what-if" scenarios involving asset deterioration, failure probabilities, or cascading effects across systems.
This limitation forces organizations into a reactive mode – waiting for assets to fail rather than preventing failures. The result? Higher lifecycle costs, increased safety risks, and inefficient use of limited budgets. Spreadsheets simply aren’t equipped to handle modern asset management demands.
Inadequate for Sustainability and Compliance Requirements
Today’s asset investment planning must address carbon reduction goals, energy efficiency, and compliance with standards like ISO 55001 or CSRD. Spreadsheets fall short when it comes to tracking Scope 1, 2, and 3 emissions alongside financial metrics.
The numbers tell the story: 81% of organizations admit to missing some internal emissions when using spreadsheets, and only 9% can comprehensively measure total emissions [10]. Scope 3 emissions – making up about 88% of a company’s carbon footprint – are especially difficult to track manually, as they span supply chains and asset lifecycles [10].
Manual tracking introduces an average error rate of 30% to 40%, which undermines the credibility of sustainability reports and exposes organizations to regulatory penalties [10]. As one industry expert put it:
"Data will often be manually reviewed and checked, copied and pasted. In some instances, we’ve even seen people calling in the data over the phone, or pulling it together from emails." – Vagenas, CEO, Industrial Sustainability Solutions [10]
Despite these challenges, 55% of organizations still rely on spreadsheets for ESG data, and 60% describe their ESG information as fragmented across various tools [10]. This disjointed approach makes it nearly impossible to ensure compliance during audits or align investments with both financial and sustainability goals.
Struggles with Large Portfolios and Reporting Demands
As portfolios grow to thousands of assets worth billions of dollars, spreadsheets begin to falter. Files become bloated and slow, with recalculations taking minutes. Complex formulas linking multiple sheets create fragile dependencies that often break unexpectedly. Spreadsheets also lack the computational power for advanced portfolio analysis.
Reporting is another major pain point. Preparing monthly or quarterly reports often requires consolidating data from multiple files, reformatting tables, and updating charts – tasks that consume days of staff time and introduce more chances for errors. When auditors request documentation, piecing together decision trails from scattered spreadsheets is time-consuming and incomplete.
These issues aren’t limited to small organizations. In February 2024, Norges Bank Investment Management reported a $92 million error caused by a spreadsheet mistake in benchmark calculations [4]. In November 2022, Islandsbanki undervalued shares during a sale due to a formula error, directly impacting profits [4].
Another challenge is the concentration of knowledge. Complex spreadsheet models are often understood by only one or two people. When those individuals leave, their expertise leaves with them, leaving teams struggling to maintain or update critical tools. This "knowledge gap" can stall decision-making just when flexibility is most needed. These limitations highlight why spreadsheets are no longer sufficient for managing large, complex portfolios.
What a Dedicated Platform Offers: 4 Key Advantages
Switching from spreadsheets to a dedicated platform can completely change how organizations approach asset investment planning. Instead of wrestling with version control issues or formula errors, teams gain access to tools built specifically for managing large-scale portfolios. A platform like Oxand Simeo™ not only solves the common problems associated with spreadsheets but also introduces capabilities that spreadsheets simply can’t offer. Here’s a closer look at how these platforms address inefficiencies and risks tied to traditional methods.
Centralized Data with Built-In Quality Controls
A dedicated platform consolidates scattered data into one reliable system, creating a single source of truth. This means all stakeholders work from a validated dataset with controlled access and automatic audit trails.
Data accuracy improves significantly through standardized collection methods. For example, the Simeo™ Go mobile app transforms field inspections into structured, consistent data. Inspectors use standardized forms with validation rules, ensuring incomplete or inconsistent entries are flagged and rejected automatically.
Direct API integrations eliminate the need for manual data transfers. The platform connects seamlessly to systems like SAP or Maximo through REST and GraphQL APIs, syncing data automatically. Historical data can also be bulk-imported, with validation rules applied during the process to maintain quality.
Role-based access controls add another layer of security. Unlike spreadsheets, where anyone can unintentionally delete a formula or alter a key assumption, platforms enforce permissions and log every change with timestamps and user IDs. This not only prevents errors but also ensures compliance and accountability.
The results are striking. Platforms with built-in validation can accelerate data collection by up to 50% compared to manual methods[11]. For instance, an Asset Director managing 66 buildings in the public sector used Oxand Simeo™ to streamline data collection and planning, saving $4 million in energy costs and cutting their maintenance backlog by 27% in just one budget cycle[11]. This solid data foundation also supports advanced planning, such as risk-based infrastructure asset management.
Predictive Models and Risk-Based Planning
By enabling dynamic risk analysis, platforms offer advanced scenario planning tools. Oxand Simeo™, for example, uses proprietary aging and energy laws alongside maintenance actions to forecast asset degradation and simulate investment strategies in seconds[11].
The Scenario Simulator helps teams explore various investment scenarios, such as the impact of budget cuts or deferred maintenance. These simulations reveal cascading effects across interconnected systems, allowing planners to make real-time adjustments. The Dynamic Planner feature further simplifies updates, letting teams drag and drop to modify costs, priorities, and timelines as conditions evolve.
Interactive dashboards turn complex data into clear visuals, such as maps and charts. These tools make it easy to pinpoint high-risk assets, compare renewal values, and present priorities to decision-makers. Instead of spending days creating presentation materials from spreadsheets, teams can generate polished visual reports instantly.
"Larger funds will no-doubt be managing a more diverse, complicated mix of assets, along with having more stringent risk management and regulatory requirements, which spreadsheet-based operating models will increasingly struggle to support." – Barnaby Nelson, Managing Director, The ValueExchange[2]
Organizations using predictive models can lower their total cost of ownership by up to 30% by focusing on prevention rather than reacting to failures[11].
Multi-Criteria Optimization for Carbon and Energy Goals
Today’s asset planning requires balancing financial constraints with sustainability goals. Platforms now integrate energy performance and carbon reduction into investment planning, ensuring every action is evaluated for both financial and environmental impact.
With these tools, portfolio managers can calculate potential energy savings (in kWh) and greenhouse gas reductions for each proposed action. Scenarios can then be simulated to balance budget limits with carbon and energy targets[11]. For instance, a manager could identify the best investment plan within a fixed budget while meeting essential carbon reduction goals.
Compliance becomes easier when energy and carbon data are integrated with financial plans. Reports for regulations like the Energy Performance of Buildings Directive (EPBD) and ISO 55000 are automatically generated, eliminating the need for time-consuming manual work. Automated reporting can cut audit preparation time by up to 70%[11].
Portfolio-Scale Automation and Audit-Ready Reports
Managing thousands of assets reveals the limitations of spreadsheets. Dedicated platforms provide the computational power and automation needed to handle large portfolios efficiently. Oxand Simeo™, for example, can process multi-year scenarios instantly and generate consistent, audit-ready reports with a single click.
Audit readiness is built into the platform. Every investment decision is linked to asset data, condition assessments, risk models, and optimization constraints. When auditors or regulators request documentation, teams can provide a complete decision trail instantly – no more scrambling to piece together spreadsheets.
The platform also integrates ISO 55000 checklists and automatically produces compliant documentation[11]. For organizations managing portfolios worth $2–3 billion or more, where spreadsheet complexity drives up operational costs, these efficiency gains are game-changing[2]. Research shows that by 2025–2027, 66% of asset owners plan to implement system automation projects, with 40% prioritizing the elimination of Excel for transformation projects[2]. Automated, audit-ready reporting not only simplifies compliance but also strengthens strategic, data-driven decision-making.
sbb-itb-5be7949
Spreadsheets vs. Oxand Simeo™: Side-by-Side Comparison
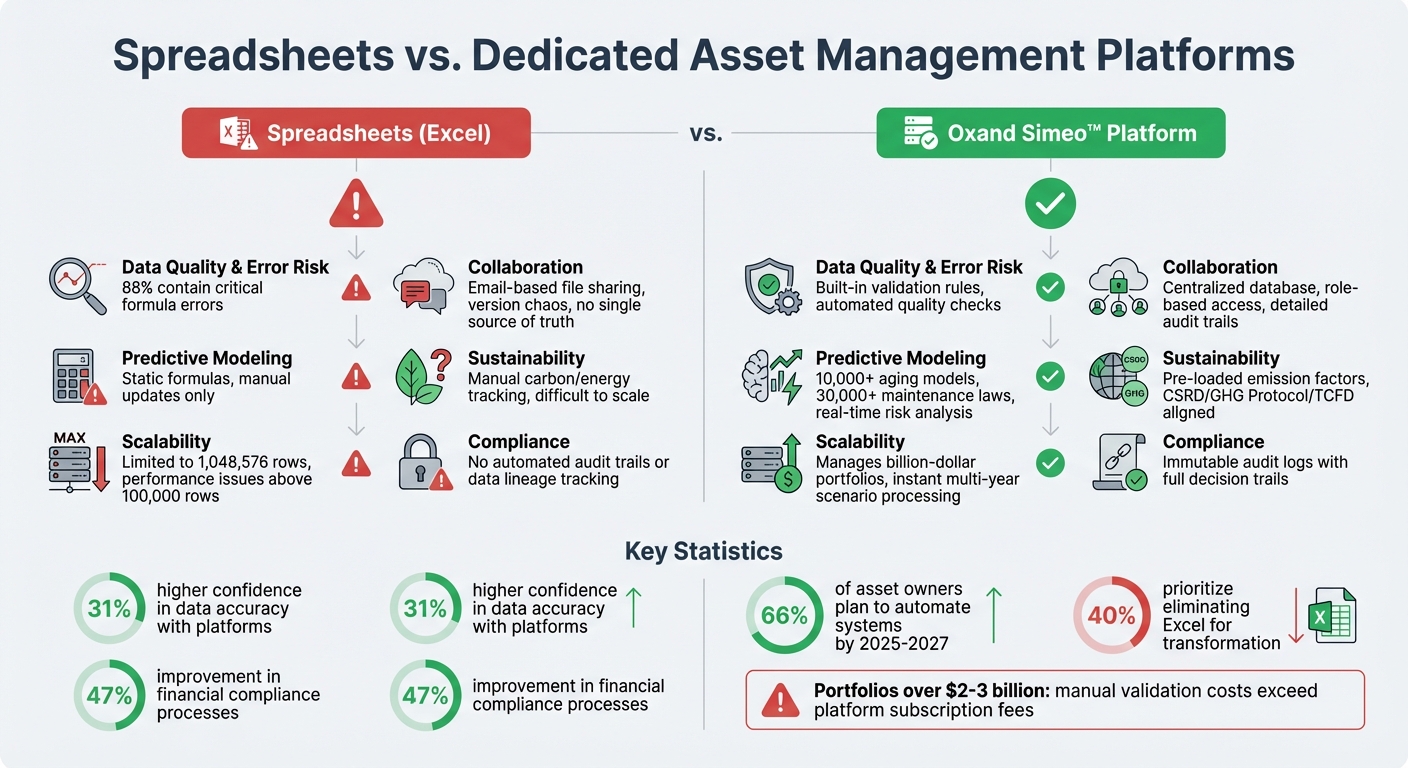
Spreadsheets vs Asset Management Platforms: Feature Comparison
As portfolios grow beyond $2–3 billion, the costs of manual validation and preparing audits often exceed the subscription fees of specialized platforms like Oxand Simeo™[2][12][14]. Understanding the differences between spreadsheets and dedicated platforms can help pinpoint when it’s time to make the switch.
The limitations of spreadsheets become glaring when tackling the challenges of large-scale asset investment planning. In fact, within the next three years, 66% of asset owners plan to automate their systems to phase out spreadsheet-based workflows. This shift highlights the increasing realization that spreadsheets simply weren’t built for the complexities of modern portfolio management[2].
Here’s a breakdown of how spreadsheets compare to Oxand Simeo™ across key features:
Comparison Table: Spreadsheets vs. Oxand Simeo™
| Feature | Spreadsheets (Excel) | Oxand Simeo™ |
|---|---|---|
| Data Quality & Error Risk | 88% of complex spreadsheets contain critical formula errors[4][5][12] | Built-in validation rules and automated data quality checks eliminate manual errors[12] |
| Collaboration & Version Control | Email-based file sharing causes versioning issues and lacks a single source of truth[1][12] | Centralized database with role-based access and detailed audit trails[12][14] |
| Predictive Modeling | Relies on static formulas that require manual updates and handle only basic calculations[14] | Advanced simulations powered by 10,000+ proprietary aging models and 30,000+ maintenance laws for real-time risk analysis |
| Sustainability Integration | Manually tracks carbon and energy data, making it hard to scale across Scope 1-3 emissions[12] | Pre-loaded emission factors and automated templates aligned with CSRD, GHG Protocol, and TCFD frameworks[12] |
| Scalability & Performance | Limited to 1,048,576 rows, with performance issues for datasets exceeding 100,000 rows[13] | Designed to manage portfolios worth billions, with instant multi-year scenario processing |
| Compliance & Audit Readiness | Lacks automated audit trails, making it hard to trace data lineage or verify sources[5][14] | Provides immutable audit logs with full decision trails tied to asset data, condition assessments, and risk models |
Switching to a dedicated platform like Oxand Simeo™ offers a clear strategic advantage. Companies that adopted such systems reported 31% higher confidence in their data accuracy and saw significant improvements – 47% – in their financial compliance processes[3].
Conclusion: Moving Beyond Spreadsheets
Spreadsheets were never built to handle the complexities of data management. They lack critical features like audit trails, source tracking, and scalability. When portfolios grow beyond a few thousand assets, navigating spreadsheets becomes a daunting task, introducing serious business risks[5].
Consider this: nearly 88% of complex spreadsheets contain major errors, and 40% of asset owners have identified "ditching Excel" as their top priority for transformation[2][5]. For portfolios in the $2–3 billion range, the costs of manually validating data, fixing errors, and conducting audits often surpass the price of investing in a dedicated platform[2][12].
The need for change is clear. This isn’t about abandoning spreadsheets overnight but about recognizing when they’ve gone from being a helpful tool to a major roadblock[12]. Organizations that have embraced specialized platforms report a 31% boost in confidence in their data accuracy and a 47% improvement in financial compliance processes[3]. Instead of managing cumbersome spreadsheets, their teams can focus on analyzing the data that drives smarter investment decisions.
João Santos, Climate Data Analyst at Nexio Projects, puts it succinctly: "This is not merely about Excel versus platforms; it’s about choosing the optimal tool to drive better investment decisions"[12]. With 66% of asset owners planning to automate their systems in the next three years, the real question isn’t whether to move beyond spreadsheets – it’s how and when to make the transition work for your organization[2].
FAQs
Why do spreadsheets fall short for large-scale asset investment planning?
Spreadsheets often fail to meet the demands of large-scale asset investment planning because they depend heavily on manual data entry, which significantly increases the likelihood of mistakes. In fact, research reveals that nearly 88% of spreadsheets contain errors, making them a shaky foundation for critical, high-stakes decisions.
Beyond accuracy issues, spreadsheets also fall short when tackling the complexities of modern asset planning. Tasks like risk analysis, carbon alignment, and scaling operations become cumbersome, if not unmanageable. They frequently lead to fragmented data that’s hard to consolidate, creating inefficiencies and undermining the decision-making process. For more reliable and effective planning, specialized platforms provide a far better alternative.
How do specialized platforms improve predictive modeling for large-scale asset investment planning?
Platforms designed for predictive modeling are reshaping the way businesses handle data by replacing outdated spreadsheets with dynamic, interconnected systems. These tools bring everything – assumptions, cash flow details, and risk factors – into one centralized hub. The result? Any updates, like shifts in market forecasts or adjustments to carbon targets, automatically ripple through all calculations. This not only eliminates the risk of manual errors but also enables users to explore multiple "what-if" scenarios in just seconds, improving both efficiency and precision.
On top of that, these platforms come equipped with advanced analytics tools, such as stress testing and Monte Carlo simulations, which go far beyond what spreadsheets can handle. Built-in workflows ensure key features like version control, validation, and audit trails are seamlessly integrated, offering clarity and compliance. With this streamlined system, asset owners gain the ability to make informed, scalable decisions confidently, all backed by reliable data.
What are the advantages of switching from spreadsheets to Oxand Simeo™ for asset investment planning?
Switching from spreadsheets to Oxand Simeo™ can transform how you handle large-scale asset investment planning. While spreadsheets often lead to errors and inefficiencies, Simeo™ offers a streamlined, cloud-based platform that prioritizes accuracy and eliminates tedious manual tasks. With real-time updates and a centralized data hub, you can make quicker, well-informed decisions while cutting down on operational risks.
Simeo™ is designed to handle the complexity of managing billions in assets and thousands of data points without slowing down. It includes tools for risk modeling, scenario analysis, and carbon alignment, making it easier to tackle intricate decision-making. Plus, its centralized governance and audit-ready reporting ensure you stay aligned with regulatory and sustainability standards. By making the switch, you’ll not only simplify workflows and enhance collaboration but also ensure your investment planning is efficient, compliant, and prepared for the future.