


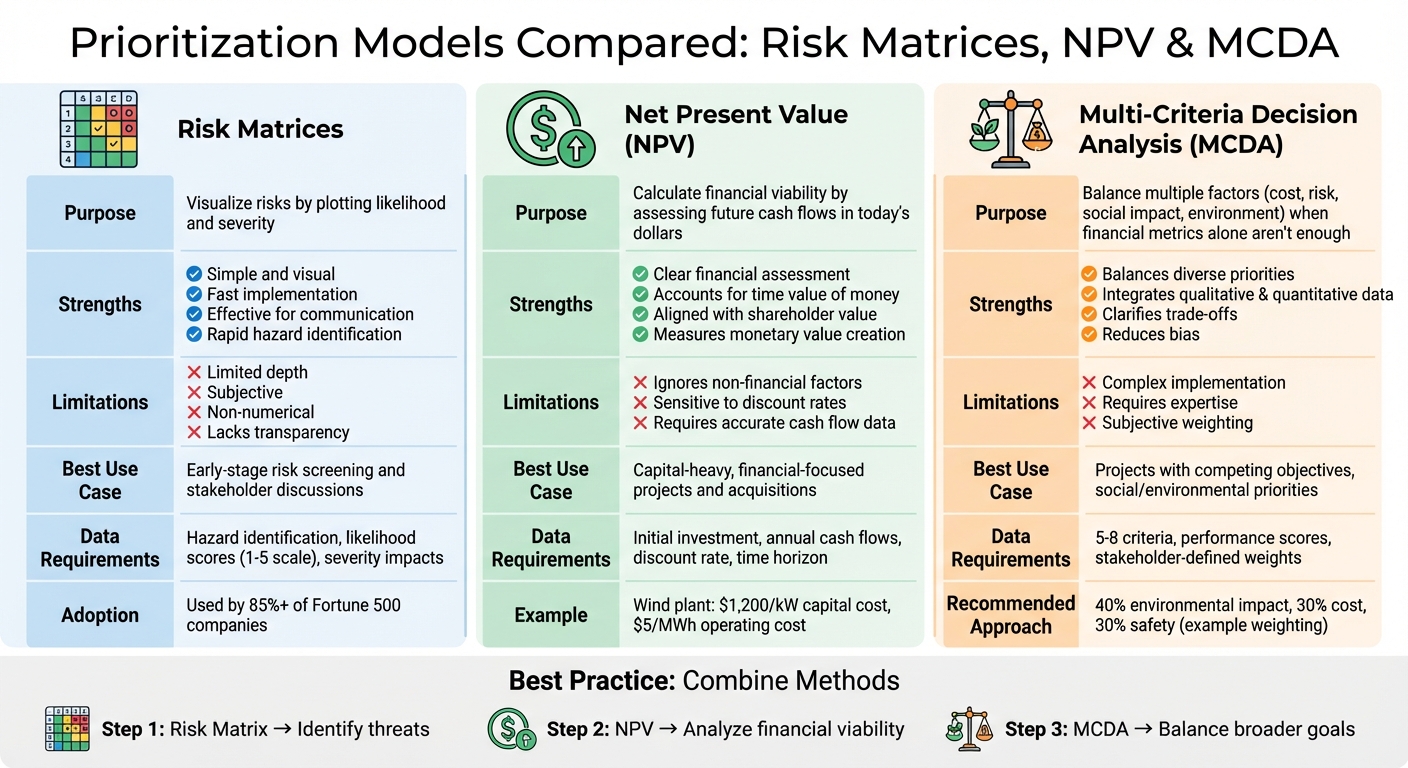
When deciding how to prioritize infrastructure projects, three tools stand out: Risk Matrices, Net Present Value (NPV), and Multi-Criteria Decision Analysis (MCDA). Each serves a specific purpose:
- Risk Matrices: Visualize risks by plotting likelihood and severity, helping you quickly identify and focus on urgent threats.
- NPV: Calculates financial viability by assessing future cash flows in today’s dollars, ideal for projects with clear financial goals.
- MCDA: Balances multiple factors (e.g., cost, risk, social impact) when financial metrics alone aren’t enough, making it great for projects with competing objectives.
To choose the right tool:
- Use Risk Matrices for early risk assessments.
- Apply NPV for financial-focused decisions.
- Leverage MCDA to weigh diverse priorities.
For the best results, combine methods. For example, start with a Risk Matrix to identify threats, use NPV for financial analysis, and finish with MCDA to balance broader goals.
Here’s a quick comparison of the three tools:
| Model | Strengths | Limitations | Best Use Case |
|---|---|---|---|
| Risk Matrices | Simple, visual, fast | Limited depth, subjective | Early-stage risk screening |
| NPV | Clear financial assessment | Ignores non-financial factors | Capital-heavy, financial projects |
| MCDA | Balances diverse priorities | Complex, subjective weighting | Projects with competing objectives |
Comparison of Risk Matrices, NPV, and MCDA for Infrastructure Project Prioritization
What is the Analytical Hierarchy Process? And How Does it Work?
sbb-itb-5be7949
1. Risk Matrices
Risk matrices are an effective way to visualize risks by plotting them based on likelihood and severity. They provide a quick snapshot of where the biggest threats lie, helping teams prioritize what needs attention first. For infrastructure and building projects, this might mean mapping out everything from climate-related dangers to operational mishaps on a grid. This approach makes it easier to identify which risks demand immediate action and sets the stage for deeper exploration of critical issues.
Harriet Chan, Co-Founder of CocoFinder, highlights their value:
"The prioritization matrix breaks down complex issues and can work objectively" [9].
However, their effectiveness depends heavily on the expertise of those using them. Faisal Nasim, Director of Exam Papers Plus, cautions:
"Necessary but unrewarding tasks can tend to be forgotten as they forge ahead with the simplest projects" [9].
This underscores a key limitation: while matrices help structure discussions, they can still be swayed by subjective opinions or internal politics. Even so, data remains an essential cornerstone for their reliability.
Data Requirements
Creating a robust risk matrix requires more than intuition. You’ll need hazard identification data that spans several categories, including:
- Strategic risks (e.g., poor investment decisions)
- Operational risks (e.g., process failures)
- Financial risks (e.g., monetary losses)
- External risks (e.g., climate change, natural disasters) [7]
For each risk, assign likelihood scores on a 1–5 scale, where 1 means highly unlikely and 5 means highly likely [7]. On the severity side, collect data on potential financial impacts (ranging from less than $1,000 for minor issues to over $1 million for catastrophic events), safety consequences, and operational downtime [6][7]. In the case of sustainable infrastructure, additional data – like historical storm patterns, shoreline responses, and erosion risks – is crucial [8].
Risk and Uncertainty Handling
Risk matrices provide a clear framework for decision-making but often fall short when it comes to capturing complex uncertainties. For example, a North American oil company found that once they quantified their risks, there was only a 5% chance of meeting their base-case projections [2]. This highlights a key limitation: while matrices are excellent for initial assessments, they don’t fully account for the unpredictability of complex projects. For higher stakes, pairing them with tools like probability distributions can help.
As Vice Vicente, an IT Compliance and Cybersecurity Expert, notes:
"While you can never eliminate risk entirely, prevention is the best insurance against loss" [7].
To keep matrices relevant, update them regularly – ideally every quarter, but at least once a year – to reflect new threats like cybersecurity vulnerabilities or climate-related changes [7].
Scalability for Portfolios
Risk matrices can be scaled to manage multiple projects, but there are limitations. Over 85% of Fortune 500 companies use matrix-based prioritization tools [9]. For complex infrastructure portfolios, expanding to a 5×5 matrix instead of the simpler 3×3 can provide more detailed categorization [6][7]. However, when projects end up with identical scores – a frequent issue – secondary matrices with more specific criteria can help resolve these ties [9].
Sustainability Integration
Risk matrices are particularly useful for incorporating external factors like climate change and regulatory shifts, which can severely impact infrastructure investments if overlooked [7]. Expanding severity assessments to include long-term environmental effects, rather than just immediate financial losses, is critical. The Institute for Water Resources at the US Army Corps of Engineers explains:
"The goal of risk assessment is to identify and describe the risk(s) associated with a decision problem and to examine and evaluate the potential impacts of the risk" [8].
For sustainable building projects, this means integrating climate forecasts, energy efficiency standards, and evolving environmental regulations into the matrix framework. Standardizing these criteria across all projects ensures consistency, making it easier to compare and rank investments effectively.
2. Net Present Value (NPV)
Net Present Value (NPV) is all about translating future cash flows into today’s dollars, giving us a clearer picture of a project’s financial viability. It reflects the time value of money, which is especially important for projects like renewable energy, where hefty upfront costs are balanced by benefits that unfold over decades.
A financial training expert underscores its importance:
"NPV is a project / investments appraisal technique that is considered to be fundamentally the most robust, and consistent with the concept of enhancing shareholder value in investment appraisal."
Data Requirements
To calculate NPV, you’ll need four main inputs:
- Initial investment: This is the total capital spent upfront (e.g., equipment, installation, land).
- Estimated annual cash flows: These are revenues minus operating costs like maintenance and fuel.
- Discount rate: This reflects either the company’s cost of capital or a project-specific rate.
- Time horizon: The period during which the asset is expected to generate value.
For renewable energy projects, the numbers become more specific. For instance, wind power plants often have capital costs of about $1,200 per kW and operating costs near $5 per MWh. On the other hand, natural gas plants come in at around $600 per kW with operating costs closer to $50 per MWh [12]. A 1 MW wind plant operating at a 30% capacity factor can produce roughly 2,628 MWh annually [12].
When cash flows don’t follow a regular schedule, Excel’s XNPV function can help since it accounts for specific cash flow dates. Remember, though, the standard =NPV() function assumes the first cash flow happens one period in the future, so the Year 0 investment should be entered separately [10][11]. Reliable input data is critical, as any inaccuracies can directly affect the risk-based infrastructure asset management.
Risk and Uncertainty Handling
NPV incorporates risk mainly through the discount rate. Riskier projects often use a higher rate, acting as a buffer. While tools like risk matrices focus on visualizing qualitative risks, NPV quantifies value in financial terms. Still, it has its limits. For instance, a Middle Eastern oil company found that one project had only a 25% chance of hitting its baseline NPV but a 90% chance of breaking even [2].
The CFI Team highlights the versatility of NPV:
"NPV analysis is a form of intrinsic valuation and is used extensively across finance and accounting for determining the value of a business, investment security, capital project, new venture, cost reduction program, and anything that involves cash flow." [11]
However, because NPV relies heavily on its inputs, even minor changes can significantly impact results [11][13]. To address this, it’s better to use probability distributions instead of single-point estimates. Running scenario analyses (e.g., best-case, worst-case, and most likely outcomes) also helps provide a clearer picture [2]. For a more balanced assessment, combine NPV with tools like IRR and Payback Period [2].
Scalability for Portfolios
NPV shines when comparing multiple projects, as it assigns a clear dollar value to each investment. The general rule? Choose the project with the highest positive NPV to maximize shareholder value. When funding is limited, ranking projects by their risk-adjusted NPV-to-investment ratio can streamline decision-making. This approach ensures resources are directed toward high-value opportunities while sidelining less promising ones [2].
Sustainability Integration
Sustainability can be incorporated into NPV by converting environmental and social benefits into cash flow projections. For example, a wind farm might factor in long-term savings from "free" fuel to offset its higher upfront costs [12]. For projects with extended lifespans – often exceeding 30 years – a perpetuity formula (Annual Cash Flow ÷ Discount Rate) can estimate value once distant cash flows lose significance [12].
That said, NPV has a key limitation:
"NPV is driven by quantitative inputs and does not consider nonfinancial metrics." [13]
This means benefits like biodiversity preservation, community health improvements, or strategic alignment often go unaccounted for unless they’re monetized. To address this, NPV works best when paired with qualitative methods to capture a broader range of impacts. Moving forward, tools like MCDA can integrate these qualitative factors that NPV alone might miss.
3. Multi-Criteria Decision Analysis (MCDA)
MCDA stands out from tools like NPV and risk matrices because it evaluates multiple factors – such as cost, risk, environmental impact, and social benefits – all at once. While NPV focuses on financial returns and risk matrices assess potential hazards, MCDA adds depth by incorporating qualitative factors that are essential for long-term infrastructure planning.
As Belton & Stewart explain:
"MCDA is intended to function as a tool to help people… to reach a decision – i.e. their decision (made by humans), not the tool’s decision." [4]
To start, define your options (e.g., renovating an existing building versus constructing a new eco-friendly facility) and establish 5–8 criteria like energy efficiency, upfront costs, and community health. Assign weights to these criteria based on their importance – say, 40% for environmental impact, 30% for cost, and 30% for safety. Then, score how each option performs on each criterion. The model calculates a weighted total, ranking your options and giving you a structured way to analyze data and manage uncertainties.
Data Requirements
To use MCDA effectively, organize your data in a performance matrix. This should include your alternatives, criteria (ideally 5–8), performance scores (both quantitative and qualitative), and weights that reflect stakeholder priorities [4] [3]. For example, in sustainable building projects, you might track energy use (measured in kWh), capital costs (in dollars), and social impact (rated on a scale) [3].
One key principle: your criteria must be "preferentially independent." This means that your preference for one factor – like renewable energy use – should not depend on another factor, such as building size [4] [3]. For sustainability-focused projects, you might also include metrics like "Average Annual Habitat Units Gained" or Technology Readiness Levels [14] [8].
A tip from UK government guidelines: separate cost and benefit criteria in public sector planning. This helps you assess value-for-money clearly at the final stage without mixing cost trade-offs into the scoring process [3].
Risk and Uncertainty Handling
MCDA handles uncertainty by using sensitivity analysis to test how changes in assumptions affect your results. Unlike NPV, which incorporates risk through discount rates, or risk matrices, which focus on probability and impact, MCDA evaluates risk alongside other factors [5]. For example, you can weigh the potential for high returns against the risk of project failure, with the trade-offs clearly visible in your weighting.
After ranking your options, tweak the weights or scores slightly to see how your results change [8] [3]. If a small adjustment flips your top choice, it’s a sign to investigate further. For more complex scenarios, MCDA can use fuzzy-set theory to handle imprecise data – helpful when working with estimates rather than exact figures [5].
The process also minimizes bias. As the 1000minds team notes:
"MCDA is intended to reduce biases from decision-makers relying on their ‘gut feeling’, and also group decision-making failures (e.g. groupthink)." [4]
By making weights and trade-offs explicit, MCDA avoids intuition-driven errors. For critical decisions, you can pair it with tools like Monte Carlo simulations or event trees to explore potential outcomes more thoroughly [8].
Scalability for Portfolios
MCDA is flexible enough to handle both small-scale and large-scale applications. For one-off projects, like comparing 80 proposals in a single planning cycle, tools like Excel often suffice [4]. For ongoing portfolio management, such as maintaining infrastructure across multiple sites, specialized software is necessary to efficiently handle thousands of alternatives [4] [8].
The World Bank‘s Infrastructure Prioritization Framework (IPF) is a great example. It uses MCDA to evaluate projects based on two dimensions: social/environmental benefits and financial/economic outcomes [1]. This is especially useful for managing portfolios of smaller projects where a full cost-benefit analysis might be too resource-intensive [1].
Before diving into a full analysis, check your performance matrix for dominated options – alternatives that are worse than another across all criteria. Eliminating these upfront simplifies your decision-making process [3].
Sustainability Integration
MCDA is particularly effective for sustainable infrastructure planning because it allows environmental and social considerations to be assessed alongside financial metrics. For instance, you can assign a 40% weight to environmental impact to ensure it’s prioritized, rather than overshadowed by cost concerns [1] [4].
The World Bank explains:
"The Infrastructure Prioritization Framework (IPF) is a multi-criteria decision support tool that considers project outcomes along two dimensions: social/environmental and financial/economic." [1]
To make this work, involve stakeholders – such as community members, environmental experts, and local officials – in workshops to set the weights collaboratively. This builds consensus and reduces individual bias [3].
However, there’s a caveat: your sustainability criteria must be preferentially independent. For example, if you’re measuring both "carbon footprint" and "energy source", ensure they’re not overlapping measures of the same impact [4]. And remember, MCDA doesn’t make decisions for you – it simply provides a framework to help you make a more informed choice.
One last note: UK government policy mandates that MCDA should only be used for long-list appraisals in public spending. For shortlisting, you’ll need to switch to Cost Benefit Analysis or Cost Effectiveness Analysis [3]. This ensures financial rigor in later stages while still taking advantage of MCDA’s strengths for initial prioritization.
Strengths and Limitations
Let’s dive into the strengths and weaknesses of Risk Matrices, NPV, and MCDA – tools we’ve previously explored in detail. Grasping these trade-offs is essential for making informed decisions about sustainable, high-impact infrastructure investments.
Each model brings something different to the table, with its own set of advantages and drawbacks:
- Risk Matrices are valued for their simplicity and speed. They’re a go-to for quickly identifying hazards and visually communicating risks to stakeholders. This makes them ideal for early-stage risk screening. However, their lack of numerical detail means they fall short for deeper financial analysis or incorporating complex sustainability metrics.
- Net Present Value (NPV) is widely recognized as the gold standard for financial analysis. As Capital City Training puts it:
"NPV is fundamentally the most robust, and consistent with the concept of enhancing shareholder value in investment appraisal" [10].
By factoring in the time value of money, NPV provides a clear picture of value creation in monetary terms. But its accuracy depends heavily on the quality of input data, and it struggles to account for non-monetary sustainability goals unless those can be expressed in dollars.
- Multi-Criteria Decision Analysis (MCDA) shines when balancing multiple, often conflicting objectives. It integrates both qualitative and quantitative data, incorporates stakeholder priorities, and reduces bias by making trade-offs more transparent [15]. According to the 1000minds team:
"simple models [like weighted-sum MCDA] have been found nearly universally in very many studies to be more accurate than the intuitive or holistic judgments of decision-makers" [4].
That said, MCDA can be complex, requiring specialized training, and its results hinge on how criteria are weighted – a process that’s inherently subjective [15].
Here’s a quick summary of how these methods stack up:
| Model | Key Strengths | Key Limitations | Best For |
|---|---|---|---|
| Risk Matrices | Easy to use; effective for visual communication; rapid hazard identification [15] | Non-numerical; lacks depth and transparency [15] | Early-stage risk screening; stakeholder discussions |
| Net Present Value (NPV) | Accounts for time value of money; aligned with shareholder value; measures monetary value creation [10] | Relies on accurate cash flow data; sensitive to discount rates; struggles with non-financial factors [10] | Capital budgeting; financial-focused projects; acquisitions |
| Multi-Criteria Decision Analysis (MCDA) | Handles diverse objectives; integrates qualitative and quantitative data; clarifies trade-offs [15] | Can be complex; requires expertise; depends on subjective criteria weighting [15] | Projects with social or environmental priorities; balancing conflicting goals; early filtering |
Sometimes, the smartest move is combining methods. For example, NPV can evaluate financial viability, while MCDA can weigh that against sustainability and risk. This layered approach works especially well in portfolio management when capital is limited. Using risk-adjusted rankings can help identify projects most likely to succeed – some studies even show this approach greatly reduces the chances of missing base-case projections.
Blending these tools creates a solid foundation for risk-based asset investment planning.
Conclusion
When deciding on the right prioritization model for your project, it’s crucial to align your choice with the project’s primary objectives. For early-stage threat screening or safety-critical assessments where clear visual communication is key, Risk Matrices are highly effective [17][18]. If your focus is on maximizing financial returns or shareholder value – especially for capital-heavy projects like acquisitions or capacity expansion – NPV is the ideal tool [10]. On the other hand, MCDA is perfect for managing conflicting goals, such as balancing social impact, environmental considerations, and financial constraints, especially when these factors can’t be easily quantified [3][19].
A layered approach often works best. Start with a Risk Matrix to pinpoint critical hazards, then evaluate financial feasibility using NPV, and finally, use MCDA to address qualitative and competing priorities. For infrastructure projects, you might begin with MCDA to evaluate qualitative benefits, such as sustainability, and then apply NPV or Cost-Benefit Analysis for final decision-making [3].
Integrating these methods doesn’t have to be complicated. Tools like Oxand Simeo™ simplify the process by combining quantitative risk assessments with NPV and MCDA in a single platform. These tools automate calculations, visualize trade-offs, and use structured methods like the Analytic Hierarchy Process, making it easier to balance sustainability, risk, and financial goals without unnecessary administrative burden.
For teams with limited resources, frameworks like the World Bank’s Infrastructure Prioritization Framework (2016) offer a practical, systematic alternative [1]. Meanwhile, if you’re managing a diverse portfolio with varying impacts, MCDA’s ability to handle multiple criteria at once becomes a critical asset [16].
Ultimately, the key is to select and combine methods that provide a well-rounded, defensible investment plan. Whether you’re prioritizing financial performance, risk management, or sustainability, knowing when and how to use these tools – Risk Matrices for hazard identification, NPV for financial analysis, and MCDA for balancing complex objectives – will help you create an optimized, risk-informed asset investment strategy.
FAQs
When is it best to use Risk Matrices, NPV, and MCDA together?
When it comes to making well-rounded decisions, combining Risk Matrices, Net Present Value (NPV), and Multi-Criteria Decision Analysis (MCDA) can be incredibly effective. Here’s how they work together: Risk Matrices help pinpoint and evaluate potential risks, NPV focuses on assessing the financial feasibility of projects, and MCDA allows you to weigh various strategic, economic, and other critical factors.
This blend is particularly effective in risk-based asset investment planning for sustainable infrastructure and buildings. In such cases, decisions often need to strike a balance between reducing risks, maximizing returns, and meeting sustainability goals. By integrating these tools, you can create a more thoughtful and balanced investment plan.
How does Multi-Criteria Decision Analysis (MCDA) account for non-financial factors compared to Net Present Value (NPV)?
MCDA is tailored to assess both financial and non-financial factors by identifying key criteria – such as environmental impact, social benefits, resilience, and sustainability – and assigning weights to indicate their relative importance. Each option is then evaluated based on these criteria, enabling decision-makers to focus on priorities like reducing carbon emissions or gaining community support without having to translate these factors into monetary terms.
On the other hand, NPV is centered entirely on financial metrics, calculating the net value of cash inflows and outflows over time. Non-financial aspects are excluded unless they can first be expressed in monetary terms, which risks overlooking broader considerations like sustainability or social impact. As a result, MCDA provides a more adaptable approach for handling complex, multi-faceted decisions, while NPV is better suited for straightforward financial analyses.
What are the challenges of using risk matrices for complex projects?
Risk matrices are straightforward and user-friendly, but they often fall short when applied to complex, multi-disciplinary projects. Their static nature can limit the ability to capture the dynamic interactions within a broader system. This can result in oversimplified risk prioritization, potentially overlooking critical threats – particularly those high-impact, low-probability events that could lead to devastating outcomes.
Another challenge lies in their reliance on subjective scales and rigid grids, which can lead to varying interpretations among stakeholders. Since they don’t quantify risks in clear, measurable terms, risk matrices fail to offer actionable insights on how much to allocate for mitigation efforts. This lack of precision makes them inadequate for performing detailed cost-benefit or ROI analyses. For large-scale projects, these shortcomings can significantly hinder effective decision-making and risk management.
Related Blog Posts
- Infrastructure Asset Management: A Risk-Based Approach for Multi-Year CAPEX Planning
- End-of-Concession Management for Highways: Strategic CAPEX Planning to Meet Grantor Requirements and Ensure Profitability
- Strategic CAPEX Planning for Highway Concessions: Balancing Grantor Compliance and Profitability at End-of-Term
- Aging Infrastructure in Europe: How to Prioritise Renewal Under Budget Constraints