


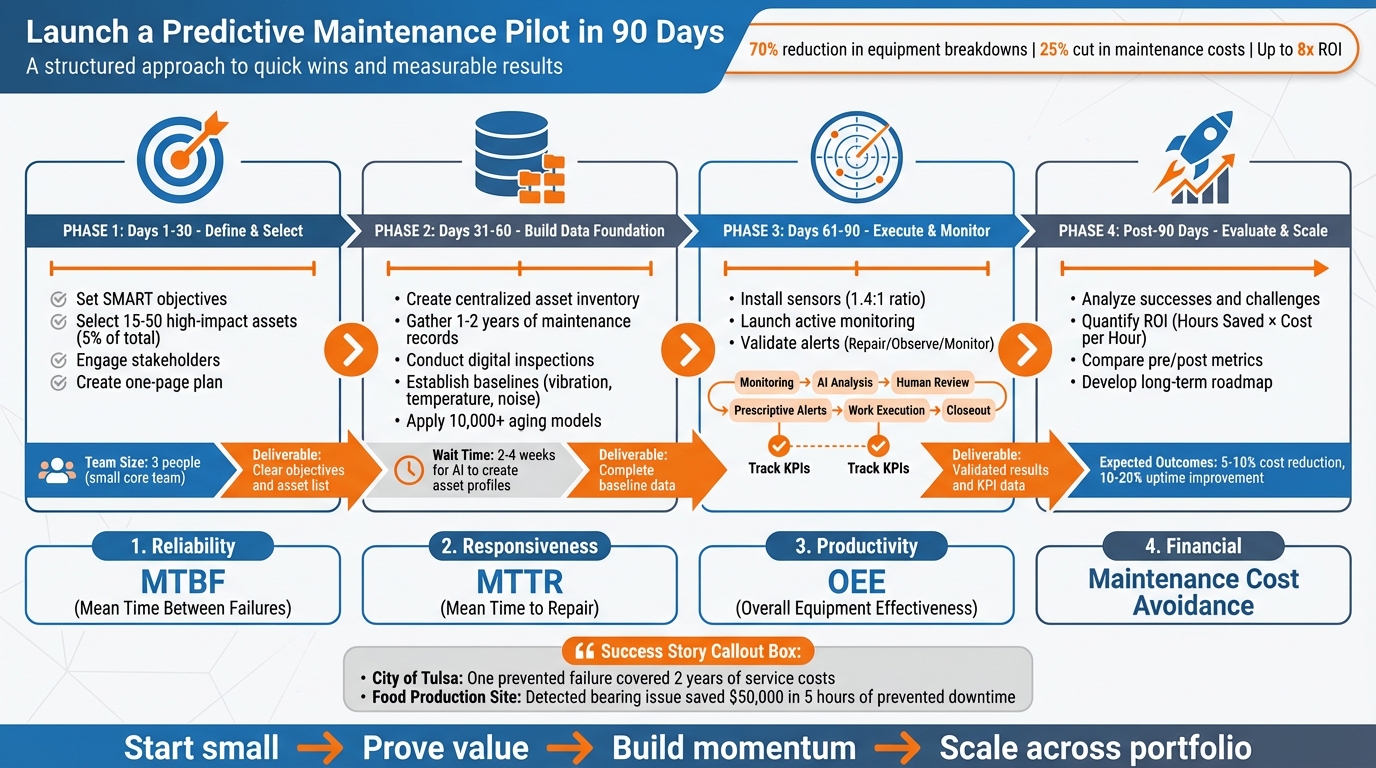
Launching a predictive maintenance pilot in 90 days is achievable and can deliver immediate results. Here’s the process in a nutshell:
- Why It Matters: Predictive maintenance reduces equipment breakdowns by 70%, cuts maintenance costs by 25%, and can deliver up to an 8x ROI. Unplanned downtime costs organizations billions annually, making this shift critical for efficiency and savings.
- Challenges: High upfront costs and skepticism from stakeholders often hinder implementation. A 90-day pilot addresses these concerns by proving value quickly.
- Steps to Get Started:
- Days 1–30: Define clear objectives (e.g., reduce downtime or costs), select 15–50 high-impact assets, and engage stakeholders.
- Days 31–60: Build a solid data foundation by creating an asset inventory, gathering historical data, and establishing baselines.
- Days 61–90: Launch the pilot, monitor results, validate alerts, and track KPIs like Mean Time Between Failures (MTBF) and cost savings.
- Key Metrics: Focus on reliability (MTBF), responsiveness (Mean Time to Repair), productivity (Overall Equipment Effectiveness), and financial impact (maintenance cost avoidance).
- Results: Successful pilots often uncover hidden issues, prevent costly failures, and demonstrate clear ROI. For example, the City of Tulsa saved enough in one incident to cover two years of service costs.
Start small, prove the value, and build momentum toward long-term improvements. This guide ensures a structured and measurable approach to predictive maintenance.
90-Day Predictive Maintenance Pilot Implementation Timeline
What is Predictive Maintenance (PdM) – How to implement it
Days 1–30: Define Objectives and Select Pilot Assets
The first month is all about setting the stage: defining your test assets, establishing clear goals, and determining how you’ll measure success. Keep your core team small – around three people – to ensure decisions are made quickly and efficiently. The aim? A simple, one-page plan that everyone can understand and rally behind.
Set SMART Objectives for the Pilot
Start by identifying the "why" behind your pilot. Are you trying to minimize emergency call-outs during inconvenient hours, lower maintenance costs for a specific asset type, or boost production uptime? Your objectives should address real business needs, not just focus on the technology. Use the SMART framework to shape your goals:
- Specific: Target a particular asset or failure mode.
- Measurable: Use key metrics like Mean Time Before Failure (MTBF) or maintenance cost savings.
- Achievable: Start with a proof-of-value approach to ensure feasibility.
- Relevant: Align with broader business priorities.
- Time-bound: Set a timeframe of 90 to 180 days to achieve actionable insights.
Write a concise, one-line statement that clarifies your goal:
"[Department] should [action] by [timeline], resulting in [outcome] while avoiding [cost of problem]."
For example: "Maintenance should reduce unplanned downtime on CNC Machine #7 by 15% within six months, saving $75,000 in lost production while avoiding costly emergency repairs." This clarity not only sharpens your focus but also simplifies communication with stakeholders who approve budgets or allocate resources.
With clear objectives in place, the next step is to choose assets that will best demonstrate the value of your pilot.
Identify High-Impact Pilot Assets
Pick assets with infrequent but costly failures – these "bad actors" often drain resources and can even bring production to a halt. For instance, a food production site once monitored its conveyor bearings and detected unusually high vibration levels in one bearing. Though the fault was inaudible to the human ear, it was caught early, allowing repairs to be scheduled during regular maintenance. This proactive move prevented five hours of unplanned downtime, saving $50,000 ($10,000 per hour). This single event justified the pilot’s value immediately.
Select 15–50 assets, about 5% of your total site assets, to increase the chance of capturing at least one failure event within 90 days. Focus on assets that meet these criteria:
- Have at least six months of historical maintenance data in your CMMS for reliable baselines.
- Exhibit progressive degradation (like changes in vibration, heat, or noise) rather than sudden failures.
- Are physically accessible for sensor installation and have reliable network connectivity.
Engage Stakeholders and Define Success Metrics
Once you’ve set your objectives and identified the assets, it’s time to bring the right people on board. Early buy-in from key stakeholders is crucial. Maintenance technicians can pinpoint vulnerable assets and verify the accuracy of alerts. IT staff ensure seamless data flow between sensors and your central system. Production managers align the pilot with business outcomes, such as improving Overall Equipment Effectiveness (OEE).
Establish clear, measurable KPIs for each stakeholder group. For example:
- Technicians: Focus on reducing emergency call-outs.
- CFOs: Look for lower maintenance spending and clear ROI.
- Production managers: Prioritize maximizing machine availability.
- Reliability engineers: Track improvements in MTBF and overall asset health.
Before you launch the pilot, establish a baseline for these metrics. This will allow you to evaluate the pilot’s impact accurately at the end of the 90-day period.
Days 31–60: Build Your Data Foundation
Now that your goals are clear and pilot assets are chosen, it’s time to focus on creating a solid data foundation. Over the next 30 days, you’ll establish a clean asset inventory, document baseline conditions, and use predictive models to gain actionable insights for your pilot program.
Set Up Your Asset Inventory with Simeo Inventory
Start by building a centralized asset register to serve as your go-to source for asset information. This register should include details like each asset’s name, type, location, manufacturer/model, installation date, warranty status, maintenance history, condition rating, and any key technical documents [10]. Organize everything into a clear hierarchy – site, building, system, and component. This way, when sensors detect an issue, you can quickly pinpoint the specific part that needs attention [9].
Next, gather 1–2 years of maintenance records from your CMMS, EAM system, or operator logbooks [9][5]. This historical data provides context for identifying common failure modes and helps establish a baseline for comparison. For your pilot, focus on about 5% of your total site assets. This keeps the data manageable while increasing the odds of capturing a failure event within the first 90 days [9].
Rank your assets on a scale of 1 to 5 based on factors like safety, production impact, downtime costs, failure frequency, and repair lead times [10]. This ranking ensures that your predictive models concentrate on the assets that have the biggest impact on your operations.
Once your inventory is in place, the next step is to document baseline conditions.
Conduct Digital Inspections and Assessments
Use digital inspection tools like Simeo GO to establish baseline operating parameters such as vibration, temperature, and noise levels [2][11]. Standardize your data entry with consistent scoring systems, failure codes, and digital templates [6].
"Without the data, you can’t predict anything. If you don’t have a baseline about what’s normal for a pump or a conveyor, you can’t identify or predict anomalies." – Bryan Sapot, CEO, SensrTrx [11]
Make sure to capture both numerical data and contextual notes, including photos. This combination provides a complete picture for later validation. For instance, if a vibration sensor detects an anomaly, technicians can check recent inspection photos to confirm whether there’s visible wear or misalignment. Also, verify early on that all digital tools have live network connectivity to avoid data gaps that could disrupt your pilot [4].
With your baseline data in place, you’re ready to move on to predictive modeling.
Apply Predictive Models and Maintenance Laws
Now it’s time to put your clean inventory data and baseline conditions to work. Platforms like Oxand use a library of 10,000+ aging models and 30,000+ maintenance laws developed from decades of real-world experience. These models simulate asset degradation, estimate Remaining Useful Life (RUL), and flag deviations from normal performance [7].
Start with Failure Modes and Effects Analysis (FMEA) to prioritize high-risk failure modes. This involves calculating a Risk Priority Number (RPN) based on severity, frequency, and detectability [7]. By doing this, you ensure your predictive algorithms focus on the most critical risks to safety, production, or costs.
Use anomaly detection models to spot deviations from the baselines you’ve established. It usually takes AI systems two to four weeks to create unique operating profiles for each asset [4]. During this period, combine AI insights with input from experienced technicians to weed out false positives and confirm that alerts are actionable [6]. For example, one major automotive manufacturer achieved 94% accuracy in predicting failures, avoiding costly unplanned downtime [8].
sbb-itb-5be7949
Days 61–90: Execute the Pilot and Measure Results
With your data framework ready, the final 30 days are all about launching your pilot and analyzing its effectiveness. This phase will show whether your predictive models can identify real issues, if your team trusts the alerts, and whether the results make scaling the initiative worthwhile.
Roll Out the Pilot and Validate Alerts
Now that the groundwork is complete, it’s time to move into active monitoring and response. Start by installing sensors on the selected assets and confirming that all connections are functioning properly. Aim for a sensor-to-asset ratio of 1.4:1 [4]. Ensure gateways integrate seamlessly with your existing network to maintain uninterrupted data flow [4].
Set up a clear process to handle alerts: Monitoring → AI Analysis → Human Review → Prescriptive Alerts → Work Execution via CMMS → Closeout [6]. This "human-in-the-loop" approach minimizes false positives and builds trust among your maintenance team.
Sort each notification into one of three categories: Repair/Future Repair, Observation, or Monitor and Wait [4]. For example, at a food production facility, predictive software flagged high vibration levels on a conveyor bearing – an issue that wasn’t detectable by sight or sound. By scheduling maintenance during a planned downtime, the team avoided five hours of unplanned shutdown, saving $50,000 at a downtime cost of $10,000 per hour. This single alert validated the pilot’s return on investment [4].
Keep stakeholders informed with regular updates and brief check-ins. These help smooth the transition through the initial surge in maintenance activity, often referred to as the "valley of worse-before-better" [3].
Monitor Key Performance Indicators (KPIs)
Once alerts are validated, focus on tracking measurable improvements through specific KPIs. Don’t wait until the end of the 90-day period to evaluate progress. Instead, set checkpoints at 30 and 60 days to compare results against your initial goals [4]. Use a mix of metrics from reliability, operational efficiency, cost savings, and energy usage to get a full picture of performance.
| KPI Category | Metric | Insights Provided |
|---|---|---|
| Reliability | Mean Time Between Failures (MTBF) | Tracks if assets are running longer without issues |
| Responsiveness | Mean Time to Repair (MTTR) | Measures how quickly repairs are completed |
| Productivity | Overall Equipment Effectiveness (OEE) | Assesses if assets are producing more with less downtime |
| Proactivity | Planned Maintenance Percentage (PMP) | Monitors the shift from reactive to planned maintenance |
| Financial | Maintenance Cost Avoidance | Calculates savings from preventing failures |
| Sustainability | Energy per Part | Tracks reductions in energy use and CO₂ emissions |
Predictive maintenance often reduces operations and maintenance costs by 5% to 10%, while smart manufacturing tools can improve equipment uptime by 10% to 20% [12]. To calculate financial savings, use the formula: (Hours of Downtime Saved) × (Cost per Hour) [4].
For better efficiency, integrate your predictive platform with your existing CMMS or ERP system. This ensures that alerts automatically generate work orders and spare parts requests [12].
Refine Based on Initial Outcomes
Use the data gathered during the pilot to make adjustments. When parts are replaced, have technicians inspect them to confirm how close they were to failing [1][2]. This step helps verify the accuracy of your models or highlights areas that need improvement.
If an asset fails unexpectedly, conduct a root cause analysis to identify what went wrong [1][2]. Was a particular failure mode overlooked? Were algorithm thresholds too high? Use these findings to fine-tune your models by adjusting sampling rates, adding new sensor types, or revising action thresholds [1][2].
For instance, a German sheet-metal shop retrofitted 12 presses with AI-enabled sensors. In just three months, they cut unplanned stops by 25% by detecting torque fluctuations that standard PLCs missed. This also improved scheduling accuracy by reducing cycle-time variance by 15% [13].
Keep your maintenance team engaged with regular feedback sessions. Ensure alerts are integrated into their daily workflows, so they aren’t dismissed as just another source of noise. A well-executed pilot not only proves the system’s value but also lays the groundwork for long-term success.
Evaluate Outcomes and Plan for Scale-Up
Analyze Pilot Successes and Challenges
Now that your 90-day pilot has wrapped up, it’s time to take a closer look at what worked and what didn’t. Start by comparing your results to the SMART objectives you set at the beginning. This isn’t just about confirming that the technology operates as expected – it’s about proving whether it actually delivers cost savings [4].
Go through every alert your system generated during the pilot. When technicians acted on these alerts and replaced parts, examine those components to see how close they were to actual failure. This hands-on validation builds trust in the system and highlights where algorithm thresholds might need fine-tuning [1][2].
Don’t be surprised if maintenance activity spikes initially. This often happens because the system uncovers previously hidden issues [3][1]. It’s a good sign – it means your baseline data is becoming more accurate. Document both your successes, like prevented failures, and any misses, such as unexpected breakdowns, to improve your models before scaling [2][1]. Keep in mind that meaningful predictive insights usually need 90 to 180 days of data to fully develop [1]. These insights will guide your next steps as you plan for broader implementation.
Quantify ROI and Business Impact
To calculate ROI, multiply the number of downtime hours avoided by the cost per hour of downtime. Evaluate improvements in reliability, cost savings, and operational efficiency. Compare your pre-pilot metrics – like Mean Time Between Failures (MTBF), Overall Equipment Effectiveness (OEE), and total maintenance expenses – with the results from your 90-day trial [1][2]. Don’t forget to account for secondary benefits, such as fewer emergency spare parts orders, reduced manual inspection hours, and a shift from reactive to planned maintenance [4][1][6]. For example, the City of Tulsa identified a critical asset failure during their trial, and the savings from that single incident covered two years of predictive maintenance service costs [6].
When presenting ROI to stakeholders, avoid technical jargon. Use clear metrics like percentage reductions in unplanned downtime, dollar savings from maintenance cost avoidance, and improvements in on-time maintenance completion rates [6]. Some organizations report that every $1 spent on predictive maintenance yields $8 in savings – a compelling argument for scale-up [6].
With these results in hand, you’re ready to transition from a pilot program to a comprehensive, portfolio-wide maintenance approach.
Develop a Long-Term Roadmap with Oxand Simeo™
Scaling up from a successful pilot requires a well-thought-out roadmap that connects initial wins to long-term asset management goals. Using the ROI and reduced downtime demonstrated in your pilot, Oxand Simeo™ can help you create a strategic plan based on real-world data.
Oxand Simeo™ combines your pilot insights with over 10,000 aging models and 30,000 maintenance laws to simulate how your entire asset portfolio will perform over time. This allows you to prioritize investments, even for assets that weren’t part of the pilot, by using probabilistic modeling to predict where failures are likely to occur and their potential costs.
Start by using your pilot data to create a criticality assessment framework. Then, systematically expand your focus to high-risk, high-cost assets first [6]. As your data grows, transition from manual analysis to automated tools powered by AI and machine learning, integrated with your CMMS or ERP systems [2][1][6].
Your roadmap should also address the organizational changes needed for success. As Terrence O’Hanlon from the Reliability Leadership Foundation puts it:
"Maintenance 4.0 is a machine-assisted digital version of all the things we have been doing for the past forty years as humans to ensure our assets deliver value for our organization" [3].
Leverage your pilot’s achievements to demonstrate value, gain stakeholder support, and build a cross-functional team – including Maintenance Managers, Reliability Engineers, IT Leads, and Operations Supervisors – to sustain predictive maintenance across your organization [6].
Set clear milestones for your scale-up plan and track progress continuously – don’t wait another 90 days to measure results. Typical outcomes include a 10–25% cost reduction on targeted maintenance activities and noticeable improvements in asset availability and energy efficiency. With a roadmap that connects your pilot’s success to long-term asset planning, you’re well-positioned to turn short-term gains into sustainable operational improvements.
Conclusion: From Quick Wins to Long-Term Value
Key Lessons from the Pilot
The 90-day pilot proved one thing clearly: predictive maintenance is all about saving money [4]. Smaller, focused teams tend to get better results compared to larger committees, and starting with just 5% of your assets – typically around 15 to 50 units – provides enough data to demonstrate value without overwhelming your organization [4].
Another key takeaway? The initial surge in maintenance activity isn’t a setback. It’s actually the system doing its job, uncovering hidden issues that were already there [1]. Success here depends on blending digital insights with the on-the-ground expertise of your technicians. This combination of technology and human judgment is what turns a pilot into a sustainable program.
The Path to Better Asset Management
The lessons from your pilot go beyond maintenance – they highlight how predictive maintenance ties into broader organizational goals. By moving from reactive fixes to proactive planning, you’re aiming for "near-zero downtime and near-zero waste." This shift impacts more than just costs; it enhances profitability, safety, and environmental outcomes [5]. Longer equipment life, fewer emergency repairs, and streamlined spare parts inventories not only save money but also make workplaces safer and reduce environmental impact.
The data framework established during the pilot – whether through Oxand Simeo™ or another system – lays the groundwork for smarter asset investment planning. With probabilistic models predicting potential failures and their costs, you can prioritize investments across your entire portfolio instead of just focusing on the pilot assets. This approach transforms maintenance from a necessary expense into a strategic tool for managing risks, maintaining service levels, and meeting decarbonization goals.
Start Your Predictive Maintenance Journey
With these insights in hand, you’re ready to scale your predictive maintenance strategy. The 90-day framework shows that you don’t need years of groundwork or a massive sensor network to get started. What you do need are clear goals, carefully chosen pilot assets, and a commitment to objectively assess results. Starting small allows you to see quick wins, build confidence, and make a strong case for expanding the program.
Oxand Simeo™ can help you take those pilot successes and scale them across your portfolio. By integrating your data with its extensive library of over 10,000 aging models and 30,000 maintenance laws, it provides a clear path forward. Whether you’re managing infrastructure, buildings, or mixed asset portfolios, the next steps are clear: use your pilot’s success to rally stakeholder support, create a standardized approach, and map out a long-term plan that links immediate cost savings to sustainable asset management. Those quick wins from your pilot are just the beginning of a journey toward measurable, long-term success.
FAQs
How can I get stakeholders on board with a predictive maintenance pilot?
To win over stakeholder support, start by presenting a clear business case that ties the pilot project to measurable financial outcomes. For example, set specific goals like cutting unplanned downtime by a certain percentage or saving on repair expenses – such as avoiding $450,000 in downtime over six months. Develop a straightforward ROI model and lay out a clear timeline, like 30 days for setup, 60 days for integration, and 90 days for optimization. This way, stakeholders will know exactly when to expect results.
Make sure the pilot aligns with your organization’s priorities and bring in a cross-functional team from the start to establish credibility. Assign clear responsibilities, schedule regular updates, and track key metrics like downtime hours, maintenance costs per asset, and labor efficiency. These data points will make the pilot’s value easy to understand and demonstrate progress effectively.
Lastly, position the pilot as a low-risk, high-reward opportunity with the potential for long-term cost savings. Emphasize how a successful pilot could slash downtime by 45–65% and prevent expensive failures. By framing the project as a strategic, results-oriented trial, you’ll help stakeholders see its long-term value and make it easier for them to commit.
What performance metrics should I monitor during a predictive maintenance pilot?
During a predictive maintenance pilot, keeping an eye on the right performance metrics is essential to gauge its success and prove its value. Start by tracking downtime reduction, which measures the percentage of time saved by preventing equipment failures. Next, evaluate maintenance cost savings to see how much money is saved through more efficient processes. Don’t forget to analyze overall equipment effectiveness (OEE) – a combination of uptime, performance speed, and quality that gives a holistic view of how well your equipment is running.
It’s also important to assess the ROI and improvements in asset uptime to understand the financial and operational benefits. Together, these metrics provide a clear picture of how effective the pilot is and can support the decision to expand predictive maintenance efforts across your operations.
How can I select the best assets for a 90-day predictive maintenance pilot?
To pick the right assets for a predictive maintenance pilot, focus on ones that can show quick, measurable results. Start by setting clear business goals – whether it’s cutting unplanned downtime, reducing maintenance costs, or boosting safety. These goals will guide you toward the most relevant assets.
Next, assess the criticality of each asset. Think about factors like the potential revenue loss from downtime (for example, $100,000 per hour), safety risks, and how essential the asset is to production. Prioritize the assets with the biggest overall impact. Also, make sure the assets you choose either already have condition data available or can be easily equipped with sensors (like vibration, temperature, or oil analysis sensors). This helps keep setup time and costs low.
To keep things manageable, select a small group of 3 to 5 high-impact assets that cover different types of equipment. Before moving forward, validate your choices with stakeholders to align expectations and get their support. This method can help your pilot generate actionable insights in just 90 days.
Related Blog Posts
- Predictive Maintenance for Asset Management (Infrastructure and Real Estate) is critical – use the web site the web site:https://theiam.org
- How predictive maintenance (without IOT and real time) brings value to infrastructure and building asset owners
- Predictive Maintenance & ROI
- How to Calculate the Real ROI of Predictive Maintenance (and Feed It into Your Investment Plan)