


America’s infrastructure is aging, with 1 in 3 bridges needing repair or replacement and 7% classified as structurally deficient. The country faces a $2.6 trillion investment gap this decade, risking $10 trillion in lost GDP by 2039. Traffic congestion alone cost the economy $87 billion in 2018. Despite this, the U.S. spends just 0.5% of its GDP on transportation infrastructure, far less than nations like China (4.8%) or Japan (1.1%).
A smarter, risk-based approach to infrastructure investment can address these challenges. Here’s how:
- Centralize Asset Data: Build a comprehensive inventory with tools like the National Bridge Inventory (NBI) and collect condition data.
- Assess Risks: Prioritize based on structural condition, climate impacts, and financial constraints.
- Use Multi-Criteria Prioritization: Rank projects by failure risk, lifecycle costs, and safety impact.
- Simulate Scenarios: Test funding strategies to optimize repairs, replacements, and long-term costs.
- Align with Standards: Develop data-driven plans that meet ISO 55001 and federal requirements.
This approach ensures funds are allocated effectively, extending asset lifespans and reducing risks while addressing long-term goals like carbon reduction. Tools like Oxand Simeo™ help agencies make data-backed decisions, cutting maintenance costs by up to 25% and improving infrastructure reliability. The decisions made today will shape the nation’s roads, bridges, and tunnels for decades to come.
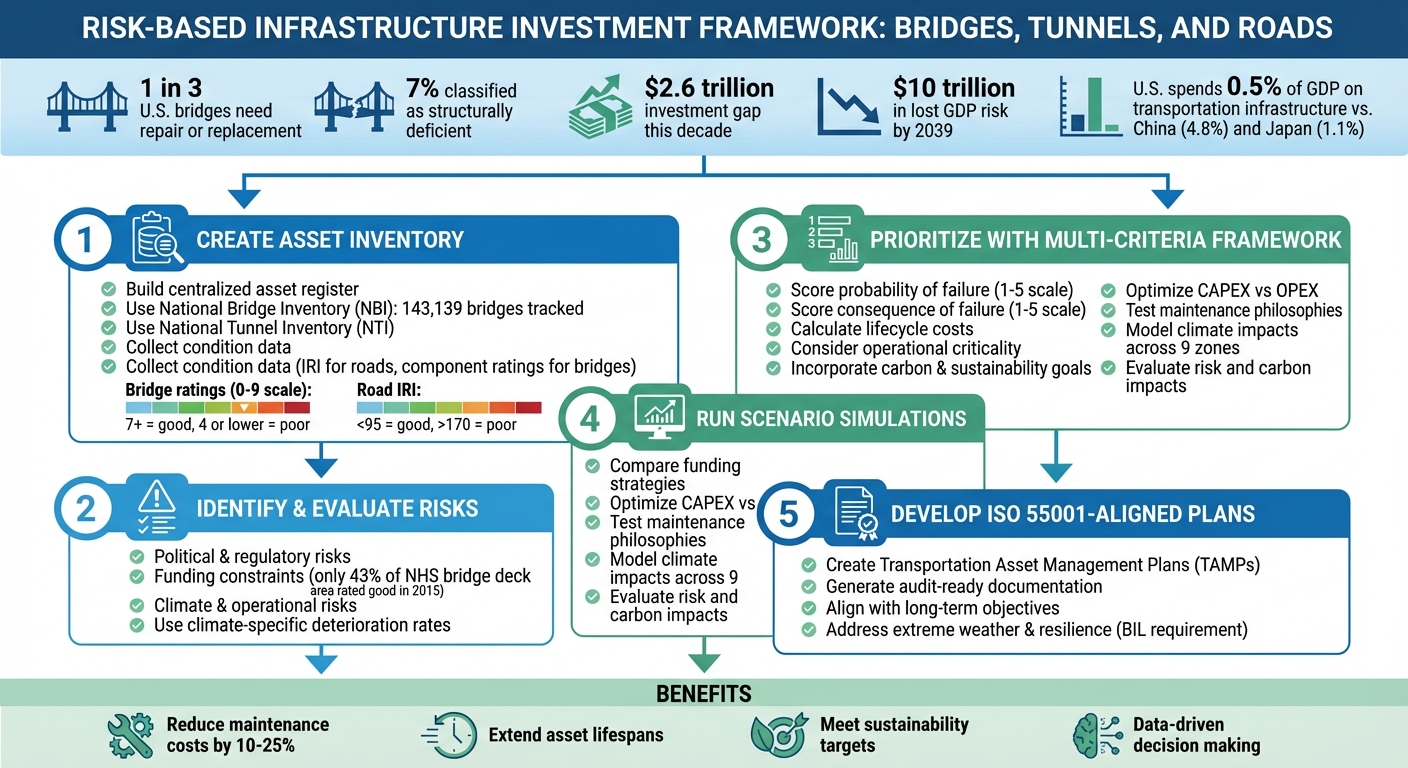
5-Step Risk-Based Infrastructure Investment Framework
Risk-based Perspective in Infrastructure Asset Management
Step 1: Create Your Asset Inventory and Assessment System
You can’t effectively manage what you don’t measure. To make smart decisions about investments and risks, you need a clear understanding of what assets you own and their current condition. This starts with building a centralized asset register and gathering reliable condition data.
Set Up a Centralized Asset Register
A centralized register acts as your go-to source for every bridge, tunnel, and road segment in your network. It should include detailed information at both the asset and inventory levels, serving as the backbone of strategic planning and spending.
To standardize your data collection, frameworks like the National Bridge Inventory (NBI) and National Tunnel Inventory (NTI) are invaluable. The NBI, for example, tracks roughly 143,139 bridges and 125,000 culverts that span more than 20 feet [2][3]. These systems make it easier to compare assets, identify patterns, and perform meaningful analyses.
"Bridge management is a core bridge discipline that focuses on making informed and effective decisions on the operation, maintenance, preservation, replacement, and improvement of bridges within a bridge inventory." – Federal Highway Administration [3]
Using a structured database, such as Oxand Simeo Inventory, ensures accurate and up-to-date asset records. These tools help create a clear asset hierarchy, capture condition data at the component level, and keep everyone on the same page. Mobile tools like Simeo GO even allow for guided, offline site inspections that sync data when you’re back online.
This foundation enables you to evaluate alternative strategies, conduct benefit-cost analyses, and prioritize projects based on risk, safety, and return on investment [3]. Without it, you’re making educated guesses. With it, you’re planning with confidence.
Once your register is in place, the next step is to dive into measuring asset conditions to guide smart, proactive investments.
Collect Condition Data for Better Decisions
While inventory data tells you what assets you have, condition data highlights which ones require immediate attention. Accurate condition assessments are key to directing funds where they’re needed most.
For roads, you can assess ride quality using the International Roughness Index (IRI), along with physical issues like cracking, rutting, and faulting [4]. For bridges, focus on both component-level ratings (deck, superstructure, substructure, and culverts) and element-level data as outlined in the AASHTO Manual for Bridge Element Inspection [2][4].
Here’s how these ratings work: Pavements with an IRI under 95 inches per mile are considered good, while those over 170 are poor. For bridges, a component rating of 7 or higher (on a 0-9 scale) is good, and 4 or lower is poor [4]. Back in 2015, only 47.3% of U.S. bridges were rated as good, while 8.3% were classified as poor. On the National Highway System, specifically, 3.7% of bridges were in poor condition [4].
This data feeds into predictive models that help you plan for the future. Using tools like Markov decision processes and transition probabilities, these models account for factors like climate, traffic volumes, and freeze-thaw cycles [2]. With this information, you can forecast when a bridge deck might need replacing or when a road segment could slip from "fair" to "poor" condition. This allows you to budget and plan maintenance more effectively.
"Bridge management decision making is highly dependent on relevant and quality data and on methodologies and tools for analyzing that data across an inventory of bridges." – Federal Highway Administration [3]
Systems like the Highway Performance Monitoring System (HPMS) for pavement data and the National Bridge Investment Analysis System (NBIAS) for bridges can centralize your condition records [2][4]. When inspection data is incomplete, NBIAS uses Synthesis, Quantity, and Condition (SQC) models to predict conditions based on existing NBI data [2]. This ensures that your planning stays on track, even when there are gaps in your data.
To make the most of your condition assessments, standardize your inspections and weight metrics like lane-miles or deck area to reflect their actual impact. Additionally, organize your inventory by environmental factors to better understand how conditions vary [2][4]. This approach turns raw data into actionable insights, paving the way for smarter spending decisions.
Step 2: Identify and Evaluate Key Risks
Once you’ve mapped out your asset inventory, the next step is to pinpoint and assess risks that could threaten your investment strategy. These risks might include political changes, budget limitations, or extreme weather events. Identifying them early allows you to craft strategies that can withstand challenges and back up your funding requests with solid data. This process lays the groundwork for resilient and focused investment planning.
Risk assessments generally focus on three main areas: political and regulatory shifts that could alter compliance requirements, financial constraints that may limit your spending power, and environmental or operational factors that speed up asset wear and tear.
Political and Regulatory Risks
Changes in policies and regulations can have a major impact on infrastructure planning. For instance, the shift from AASHTO Commonly Recognized Elements to SNBIBE has required adjustments to investment priorities. New federal mandates now demand structural element data for all bridges in the National Highway System, adding another layer of complexity. Legislative uncertainty and the need to coordinate among state, federal, and tribal agencies further complicate long-term planning.
To navigate these challenges, decision-support tools can help model tradeoffs between funding and performance. The Federal Highway Administration highlights this approach:
"The National Bridge Investment Analysis System (NBIAS) was developed to assess national bridge investment needs and the tradeoff between funding and performance." – Federal Highway Administration [2]
Funding and Financial Risks
Budget limitations are often the most immediate hurdle for infrastructure projects. Tools like NBIAS can quantify the relationship between funding levels and network performance. For example, in 2015, only 43.0% of the National Highway System bridge deck area was rated in good condition, while 5.5% fell into the poor category – a clear sign of chronic underfunding [4].
Cost overruns can derail even the best-laid plans, making it essential to adjust unit costs for inflation and apply state-specific cost factors. Many planners are now adopting "State of Good Repair" strategies, which prioritize early investments to maintain sustainable asset conditions and reduce long-term maintenance expenses. Simulating budget scenarios can help determine when replacing an asset is more cost-effective than ongoing preservation. It’s worth noting that preventive maintenance is far less expensive than major rehabilitation [4].
Climate and Operational Risks
Environmental factors play a significant role in asset deterioration. Modern methods now incorporate regional climate data to more accurately predict wear and tear [2].
David Y. Yang from Portland State University emphasizes the importance of this approach:
"The primary goal of the research is to achieve risk-based transportation asset management based on (a) objective and consistent risk assessment and (b) effective prioritization and optimization of intervention strategies." – David Y. Yang, Portland State University [1]
Operational issues, such as insufficient vertical clearance or inadequate load capacity, require their own solutions. Addressing these problems involves weighing the cost of necessary improvements against the potential expenses of diverting traffic. Functional improvements often focus on factors like lane and shoulder widths, load ratings, and clearances. For example, the National Bridge Inventory includes around 125,000 culverts, which need specialized analysis due to their unique structure. Using climate-specific deterioration rates and accounting for traffic growth – whether steady or exponential – helps avoid underestimating future maintenance needs. These insights are critical for moving toward risk-based investment prioritization in the next stages of planning.
Step 3: Prioritize Investments Using Multi-Criteria Frameworks
After assessing risks, the next step is to refine investment decisions using a multi-criteria framework. With risks quantified, you can rank infrastructure projects by weighing various priorities – like safety, cost, long-term durability, and service levels – against one another. This structured approach ensures that tradeoffs are clear and decisions are well-supported.
The aim here is to move away from subjective choices and create a prioritization system that balances probability of failure, consequence of failure, and lifecycle costs while aligning with your organization’s broader goals. Focus on addressing high-risk, high-impact assets first, while also considering regulatory compliance and financial sustainability over the long term.
Balancing Risk, Lifecycle Costs, and Service Levels
Building on the earlier risk analysis, you can score each asset’s vulnerability using a consistent framework tailored to multi-criteria prioritization. Many agencies use a 1-to-5 scale to rank both the probability of failure (based on factors like structural condition, age, and maintenance history) and the consequence of failure (such as repair costs, service disruptions, and environmental damage) [6]. Multiplying these scores gives you a risk rating to identify assets that pose the greatest threat to the system’s performance.
Lifecycle costs add another critical layer to this analysis. These costs consider whether ongoing maintenance or full replacement is more economical in the long run. For instance, tools like NBIAS use optimization models to compare funding levels against over 200 performance measures [2]. This helps determine when replacing an aging bridge is more cost-effective than continued repairs. Location also plays a role – assets near critical crossings like waterways, railroads, or dense urban areas often take precedence because of their importance to network connectivity and public safety.
A recent example of this approach comes from Portland State University’s collaboration with the Oregon Department of Transportation (ODOT) and the Federal Highway Administration (FHWA). In July 2024, they completed a project aimed at creating a framework for risk-based management of bridges and tunnels. Led by David Y. Yang and Arash Khosravifar, the study developed methods to assess risks at both the agency and network levels, helping prioritize interventions for deteriorating infrastructure [1].
Service levels further refine prioritization. Standards for functional improvements – like lane width, shoulder width, load ratings, and vertical clearances – should guide decisions. For example, the Federal Highway Administration’s NBIAS framework calculates "user costs", such as the economic impact of diverting trucks due to weight restrictions. These metrics highlight the tangible effects of deferred maintenance, helping justify funding by showing how investments reduce both agency expenses and public disruptions [2].
| Criteria Category | Key Factors to Evaluate |
|---|---|
| Probability of Failure | Structural condition, age, maintenance history, material type, hydraulic capacity |
| Consequence of Failure | Repair costs, impact on critical users (hospitals/schools), environmental effects, legal costs |
| Operational Criticality | Service area size, proximity to key crossings (railroads, waterways) |
Incorporating Carbon and Sustainability Goals
Environmental considerations are increasingly vital in prioritizing investments. The Bipartisan Infrastructure Law (BIL), effective October 1, 2021, requires state departments of transportation to factor in extreme weather and resilience when conducting lifecycle cost and risk analyses [5]. Incorporating climate risks and carbon reduction targets into your framework complements the risk prioritization strategies outlined earlier.
"State DOTs are required to consider extreme weather and resilience as part of the lifecycle cost and risk management analyses within a State TAMP." – Federal Highway Administration [5]
In addition to safety and reliability metrics, set environmental goals, such as reducing carbon emissions from maintenance activities or extending asset lifespans to lower the overall carbon footprint of replacements and new construction [7]. Scenario modeling tools can help visualize how different funding levels impact both network performance and environmental outcomes, making it easier to balance immediate budget constraints with long-term goals.
Federal regulations (23 CFR part 667) now mandate periodic evaluations of facilities that have faced repeated repairs or reconstructions due to emergencies [5]. Your framework should account for climate projections – including temperature shifts, rainfall changes, and extreme weather patterns – to ensure assets remain functional under evolving conditions. By prioritizing projects based on their environmental impact and resilience to future climate risks, you can align your investment strategy with both regulatory requirements and sustainability objectives.
Step 4: Run Scenario Simulations and Optimizations
After completing multi-criteria risk assessments, the next step is to refine your budget allocation strategy through scenario simulations. Once you’ve scored and ranked your assets using these frameworks, it’s time to evaluate how different funding levels and strategies will perform over time. Scenario modeling helps you analyze the long-term effects of various budget allocations on network performance, risk exposure, and carbon emissions. By comparing scenarios side by side, you can pinpoint the strategy that aligns with your objectives and constraints.
Oxand Simeo™ employs probabilistic models and optimization algorithms to simulate how assets age under different maintenance strategies. For example, you can test approaches like "Minimize MR&R Costs", which focuses on avoiding catastrophic failures but may lead to a gradual decline in network performance, or "State of Good Repair", which prioritizes significant early investments to bring assets to good condition and then maintains them with smaller, ongoing expenses. These simulations provide a solid foundation for evaluating maintenance philosophies and funding strategies.
Optimize CAPEX and OPEX Across Scenarios
A key question to address is: Should you keep repairing an asset, or is it more cost-effective to replace it entirely? Use simulation tools to weigh ongoing maintenance costs (OPEX) against the expense of full replacement (CAPEX) to determine the best long-term approach. This method helps avoid over-investing in outdated assets or replacing them prematurely.
Budget constraints can also be modeled in various ways, such as setting fixed annual budgets, defining budget growth rates, or requiring a minimum benefit-cost ratio (BCR) to meet performance targets. For instance, the Federal Highway Administration (FHWA)’s "Improve Conditions and Performance" scenario demonstrates that increased annual investments can significantly reduce the number of assets in poor condition [2].
When running these simulations, consider climate-specific factors like deterioration rates. Tools like NBIAS account for varying deterioration probabilities across nine distinct climate zones, acknowledging that assets in harsher environments, such as coastal or freeze-thaw areas, degrade faster than those in milder climates [2]. These inputs ensure your scenarios are grounded in real-world conditions, not generic assumptions.
Compare Risk and Carbon Impacts Across Scenarios
Cost is just one piece of the puzzle. It’s equally important to evaluate how each scenario affects risk profiles and carbon emissions. For example, compare the trade-offs between agency costs, such as repair and replacement expenses, and user costs, like those incurred when commercial vehicles are forced to detour around weight-restricted bridges or when drivers face deteriorating pavement [2]. In some cases, deferred maintenance can lead to higher risks and increased carbon emissions due to longer travel distances and greater fuel consumption. As the FHWA notes, the need to raise a bridge may become clear if "the stream of discounted excess cost of diverting commercial vehicles around the bridge exceeds the cost of improving the bridge" [2].
"The State of Good Repair strategy, although the most aggressive, generates results more consistent with agency practices and recent trends in bridge condition than the other three strategies evaluated." – Federal Highway Administration [2]
Simulations also allow you to explore how different maintenance strategies impact sustainability goals. For instance, the "State of Good Repair" approach requires higher upfront CAPEX but results in better long-term conditions, reduced agency costs, and a smaller carbon footprint by minimizing emergency repairs and premature replacements [2]. By analyzing scenarios in terms of risk reduction, lifecycle costs, and carbon savings, you can identify an investment path that strikes the right balance between financial limitations, long-term resilience, and environmental responsibility.
sbb-itb-5be7949
Step 5: Develop ISO 55001-Aligned Investment Plans
Once your simulations are complete, it’s time to formalize your findings into an investment plan that aligns with ISO 55001 standards. In the U.S., Transportation Asset Management Plans (TAMPs) provide the key framework for this type of documentation. These plans require state Departments of Transportation (DOTs) to include lifecycle cost and risk analyses. Since October 1, 2021, federal requirements under the Bipartisan Infrastructure Law (BIL § 11105) have also mandated that TAMPs address extreme weather and resilience explicitly [5].
Your investment plan should connect decisions to objective risk assessments, performance targets, and long-term goals. This means detailing not only what you plan to invest in but also why those decisions were made, how they align with strategic objectives, and what trade-offs were considered. Essentially, this step transforms the insights from your simulations and risk evaluations into actionable strategies.
Generate Audit-Ready Documentation
Start by ensuring your data collection and reporting adhere to standardized methods. For example, transitioning to the AASHTO Manual for Bridge Element Inspection ensures condition data follows uniform specifications, which is critical for transparency across agencies and compliance with federal standards [2]. Tools like NBIAS paired with SQC models can then link inspection data directly to investment needs [2].
Your documentation should include visual outputs that clearly show how funding impacts performance outcomes. For instance, NBIAS can evaluate how different funding levels affect over 200 performance measures [2]. These visualizations are particularly useful for building stakeholder confidence. They can demonstrate, for example, how a specific budget scenario affects the percentage of bridge deck areas rated as good or poor, the number of structurally deficient bridges, and the overall risk exposure across your network.
Additionally, include detailed justifications for functional improvements. If you’re evaluating whether to raise a bridge for better vertical clearance, document the excess costs associated with diverting vehicles around the bridge to support the investment decision [2]. This level of transparency ensures that auditors, lawmakers, and the public can understand the economic and safety rationale behind each project.
By capturing these insights thoroughly, your documentation will naturally align with your organization’s broader strategic objectives.
Align Plans with Long-Term Objectives
To maintain a risk-based approach, link current investment decisions to your organization’s long-term goals. An ISO 55001 investment plan should integrate broader priorities such as sustainability, compliance, and lifecycle optimization. For instance, in July 2024, the Oregon Department of Transportation, in partnership with Portland State University, established a framework for bridge and tunnel asset management that emphasizes objective risk assessments and network-level evaluations [1]. This ensures that investment priorities address both immediate needs and long-term resilience.
When finalizing your plan, compare various investment strategies to highlight their long-term impacts. The "State of Good Repair" approach, for example, involves higher upfront costs but ensures better long-term asset health and aligns more effectively with sustainability goals [2]. As the Federal Highway Administration explains:
"The State of Good Repair strategy, although the most aggressive, generates results more consistent with agency practices and recent trends in bridge condition" [2].
Don’t forget to incorporate climate-adjusted modeling into your plan. Specify deterioration rates for each bridge element, adjusting for climate zones. For example, NBIAS uses probabilistic modeling across nine climate zones to account for environmental factors affecting asset longevity [2]. This level of detail ensures your plan is grounded in practical, data-driven insights and can stand up to scrutiny from auditors, regulators, and stakeholders who expect well-supported decisions.
Case Examples: Prioritizing Bridge, Tunnel, and Road Investments
Examples from across the U.S. highlight how risk-based investment strategies can transform infrastructure management.
North Carolina’s data-driven replacement model showcases a transparent approach to prioritizing infrastructure needs. The North Carolina Department of Transportation (NCDOT) collaborated with researchers Matthew J. Whelan and Tara L. Cavalline from the University of North Carolina at Charlotte to improve its Priority Replacement Index (PRI). Using binary logistic regression, they developed a model to predict which bridges were most likely to require replacement. This method not only ensured a balanced prioritization but also significantly reduced the number of bridges mistakenly flagged for replacement [8]. The result? A system that made investment decisions more defensible and aligned with actual needs.
Other states have also adopted innovative frameworks for prioritization. Oregon’s network-level risk framework is a prime example of optimizing resource allocation under tight budgets. In July 2024, the Oregon Department of Transportation (ODOT) partnered with Portland State University researchers David Y. Yang and Arash Khosravifar to create a risk-based management framework for bridges and tunnels. This framework introduced an objective way to assess risks for deteriorating assets while evaluating user risks across the network. By applying this methodology, ODOT could consistently assess risks throughout its inventory and focus on interventions that delivered the highest risk reduction for the money spent [1].
At the federal level, modeling functional improvements highlights how benefit-cost analysis supports complex decisions. The Federal Highway Administration (FHWA) incorporated a bridge improvement model from the Florida Department of Transportation into the National Bridge Investment Analysis System (NBIAS). This allowed NBIAS to refine its analysis for functional upgrades, such as increasing a bridge’s vertical clearance. The model weighed the costs of construction against the economic impact of rerouting commercial vehicles due to low-clearance structures. By comparing these factors, the system provided a clear, data-backed justification for functional improvements [2].
Across these examples, a shared theme emerges: subjective decision-making gives way to transparent, data-driven processes. These strategies link condition assessments, risk evaluations, and economic considerations, ensuring that investments address the most pressing needs. Whether managing statewide bridge inventories or regional tunnel networks, these approaches demonstrate how using objective evidence can improve reliability, reduce risks, and make the most of limited resources. Each dollar spent is carefully calculated to maximize impact, ensuring safer and more efficient infrastructure.
Add Sustainability and Decarbonization to Infrastructure Investments
Incorporating decarbonization into infrastructure investment strategies isn’t just a smart move – it’s essential for ensuring assets remain viable and aligned with long-term goals like net-zero emissions.
The clock is ticking for infrastructure owners. Consider this: bridges and tunnels, which often last over 50 years, will likely go through just one replacement cycle before 2050 [9]. That means every replacement must support net-zero targets. Failing to do so risks creating stranded assets – investments that could become obsolete before their lifespan ends. Aligning these projects with decarbonization goals safeguards both the environment and the financial future of these investments.
Transportation is a major contributor to emissions, accounting for 28% of direct greenhouse gas emissions in the U.S. [9]. This makes infrastructure decisions particularly impactful. But here’s the challenge: incremental upgrades that reduce emissions slightly might actually lock in outdated, higher-emission technologies. As the National Academies of Sciences, Engineering, and Medicine puts it:
"Policies that produce incremental reductions in emissions without facilitating transformation can lead to technology lock-in and emissions cul-de-sacs that make deep decarbonization by midcentury unattainable" [9].
It’s not just about cutting emissions – it’s about doing so in a way that transforms systems. Mitigation and adaptation efforts often go hand in hand. In fact, over half of climate adaptation projects – like flood-proofing roads or improving tunnel ventilation – also lead to long-term reductions in greenhouse gases [10]. Including projected CO₂ reductions in cost–benefit analyses can strengthen the case for these investments, making it easier to justify climate-focused goals.
Material and design choices also play a critical role. For instance, opting for treated wood instead of traditional concrete can lower a project’s carbon footprint while also improving flood resilience [10]. For roads, which typically last 20–40 years, integrating features like EV charging stations and heat-reflective coatings not only supports decarbonization but also boosts operational efficiency. As the World Resources Institute highlights:
"Fully accounting for the mitigation benefits of adaptation projects can help crystallize their relationship and drive finance toward projects that achieve both" [10].
These choices don’t just reduce emissions – they make investments more resilient and future-proof.
Acting now is crucial, especially when it comes to enabling infrastructure. For example, building high-voltage transmission lines to connect renewable energy sources to transportation networks can take 8–10 years just for permitting [9]. Delays in these projects could force reliance on higher-carbon, interim solutions. By aligning major replacements with 2050 net-zero goals, infrastructure owners can avoid stranded assets and ensure strategic risk management.
Conclusion: Your Risk-Based Roadmap for Infrastructure Investments
Managing infrastructure like bridges, tunnels, and roads doesn’t have to be overwhelming. With a structured plan, it’s possible to take control and make smarter, long-term decisions. This guide’s five-step framework lays out a practical approach: creating a centralized asset inventory, evaluating key risks, prioritizing investments with multi-criteria methods, running scenario simulations, and aligning plans with ISO 55001 standards.
The advantages of this proactive, risk-based planning approach are undeniable. Moving away from reactive maintenance to a strategy focused on long-term risks and needs can significantly cut costs and prevent the steady decline caused by short-term fixes.
Thanks to data-driven tools, this shift is more achievable than ever. Platforms like Oxand Simeo™ transform raw asset data into actionable, multi-year investment plans. These tools help you decide what to invest in, when to do it, and how to stay within budget – all while addressing energy use and carbon reduction goals. With proprietary aging models and maintenance protocols, these platforms enable precise risk assessments and smarter prioritization. Organizations often see maintenance costs drop by 10–25% while extending asset lifespans and meeting sustainability targets.
The decisions made today will shape infrastructure for decades. Bridges and tunnels can last more than 50 years, while roads need replacement every 20–40 years. By incorporating sustainability goals, using detailed condition data, and exploring different scenarios, you can avoid stranded assets and ensure your investments stand the test of time.
The path is laid out, and the tools are ready. By adopting these strategies, you can secure resilient, sustainable infrastructure for the future.
FAQs
How can a risk-based investment strategy help improve the management of bridges, tunnels, and roads?
A risk-based investment strategy empowers infrastructure managers to make informed decisions by concentrating on the likelihood of asset failure and its potential consequences. By evaluating and ranking bridges, tunnels, and roads based on measurable risks, managers can prioritize essential repairs and allocate budgets more efficiently. This ensures that high-risk assets are addressed first, while avoiding unnecessary expenses on structures deemed low-risk.
This method not only enhances safety and system performance but also helps extend the lifespan of infrastructure. For instance, tailoring inspection schedules to the level of risk enables better use of resources, cutting costs without compromising safety. Integrating risk assessments into planning also aligns with federal guidelines and contributes to building a more resilient infrastructure network – one better equipped to handle challenges like extreme weather or increased traffic demands.
How do climate and operational risks influence infrastructure investment planning?
Climate and operational risks are key factors that influence decisions around infrastructure investments. Climate risks – like rising temperatures, intense rainfall, flooding, and more frequent extreme weather – can speed up the wear and tear on critical structures such as bridges, tunnels, and roads. To tackle these issues, planners evaluate how these hazards affect vital assets and direct investments toward projects that enhance durability, improve safety, and extend the lifespan of infrastructure.
Operational risks – such as damage from heavy traffic, delays in maintenance, inspection schedules, and the reliability of monitoring systems – are just as crucial. Risk-based inspection programs help agencies allocate resources more effectively by focusing on structures that pose the highest risks. This approach ensures timely repairs and lowers the chances of sudden failures. By combining data on both climate and operational risks, infrastructure managers can make smarter, more cost-efficient decisions that address immediate concerns while planning for the future.
How can scenario simulations improve investment decisions for infrastructure projects?
Scenario simulations empower infrastructure managers to make smarter investment choices by exploring a variety of "what-if" scenarios before committing resources. Using data like asset conditions, deterioration rates, and cost-benefit analyses, these tools generate multiple strategies tailored to different budgets, maintenance plans, or resilience upgrades. This helps decision-makers weigh outcomes such as enhanced safety, reduced travel delays, or longer asset lifespans, enabling them to select the most effective path forward.
These simulations also factor in uncertainties such as traffic growth, climate effects, or fluctuating construction costs. This ensures a risk-based approach for prioritizing crucial assets like bridges, tunnels, and key roadways. At the same time, they offer a clear understanding of how budget limitations impact results, guiding agencies to allocate funds in ways that align with performance targets.
By illustrating the long-term consequences of underfunding versus strategic investments, scenario simulations promote transparency with stakeholders, strengthen funding proposals, and align projects with sustainability objectives. They help minimize risks while ensuring every dollar spent delivers maximum value.
Related Blog Posts
- Infrastructure Asset Management: A Risk-Based Approach for Multi-Year CAPEX Planning
- End-of-Concession Management for Highways: Strategic CAPEX Planning to Meet Grantor Requirements and Ensure Profitability
- Strategic CAPEX Planning for Highway Concessions: Balancing Grantor Compliance and Profitability at End-of-Term
- Aging Infrastructure in Europe: How to Prioritise Renewal Under Budget Constraints