


Managing investments across multiple sites is challenging, especially when balancing aging infrastructure and lifecycle management, limited budgets, and stakeholder demands. The traditional reliance on spreadsheets often leads to fragmented decisions, short-term fixes, and increased long-term costs. A better approach? Use a risk-based framework to prioritize asset investments.
Here’s how it works:
- Shift from Age-Based to Risk-Based Decisions: Assess failure likelihood (condition, environment, usage) and consequences (safety, reliability) to allocate resources where they make the most impact.
- Standardize Processes Across Regions: Create a unified framework for evaluating asset conditions, risks, and costs – ensuring consistency even with local variations.
- Integrate Data: Use centralized systems to link asset data (e.g., EAM, GIS, ERP) for better visibility and decision-making.
- Leverage Scenario Planning: Test different budget levels and strategies to understand long-term impacts, from cost savings to emissions reduction.
- Embed Sustainability Metrics: Treat carbon emissions and energy use as measurable costs, aligning investment decisions with ESG goals.
For example, a utility company reduced total ownership costs by 22% with a 10% budget increase for targeted refurbishments, while a 10% budget cut added $4.3M in costs over five years. The takeaway? Data-driven, risk-focused planning helps organizations optimize investments, reduce risks, and meet broader goals.
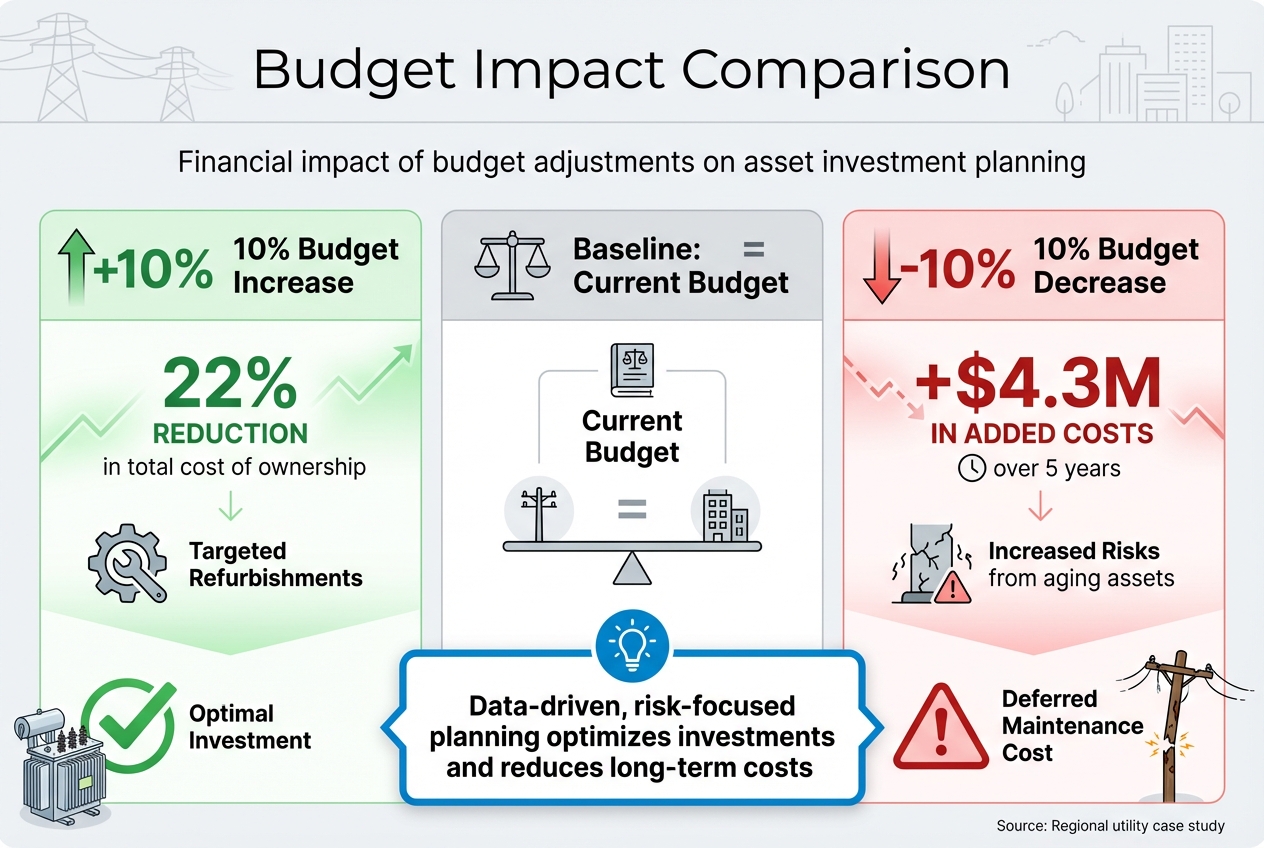
Budget Impact on Asset Investment: 10% Increase vs 10% Decrease Over 5 Years
Strategic Intervention Planning for Asset Performance and Risk Management
sbb-itb-5be7949
Creating a Standardized Framework for Multi-Site Investment Planning
When managing investments across multiple sites, the lack of alignment between teams can lead to fragmented decision-making. Engineers might focus on asset condition, finance teams on cash flow, and operations on uptime, creating a tug-of-war over priorities. To bridge this gap, a unified framework is key. A shared approach ensures everyone speaks the same "language" when making decisions, streamlining capital allocation.
The answer lies in a standardized lifecycle value framework that applies consistently across all locations. This framework includes six essential components: defining organizational goals and performance metrics, establishing how asset risk is calculated, quantifying risk as a cost, identifying intervention strategies (like run-to-fail, refurbish, or replace), running scenario optimizations, and maintaining a continuous feedback loop for improvement [1]. The ISO 55000 series offers a helpful starting point, linking high-level objectives to actionable, site-specific strategies through a Strategic Asset Management Plan (SAMP) [2].
A cornerstone of this approach is creating a shared Value Framework to calculate failure consequences uniformly across regions. While local factors – like climate, duty cycles, and operating conditions – affect the "likelihood of failure", the broader framework remains consistent. Importantly, organizations don’t need perfect data to get started. Applying the 80/20 rule can pinpoint the key drivers (like operating environment) that account for most asset conditions [1]. This consistency lays the groundwork for effective risk assessments, which are explored further in the next section.
Setting Up Risk-Based Prioritization
Risk-based prioritization offers a smarter alternative to traditional, age-based asset replacement. By categorizing assets into high, moderate, and low-risk groups, organizations can tailor their strategies. High-risk assets might require preventive measures, while low-risk ones could be left to run-to-fail, saving unnecessary costs [4].
Treating risk as a measurable cost allows leadership to weigh intervention expenses against the potential consequences of inaction. For instance, factoring in lifecycle costs and failure risks enables a direct comparison: Should you replace a transformer now, or continue operating it for five more years? This decision would account for failure probabilities, emergency repair costs, and potential service disruptions [1]. This approach ensures investments are directed where they reduce the total cost of ownership most effectively.
Setting Up Governance and Decision-Making Policies
Strong governance ensures clarity and consistency across all levels of an organization. Each group has specific needs: executives require a portfolio-wide view of risks and costs, finance teams need insight into cash flow timing, asset managers benefit from a clear pipeline of condition-to-capital needs, and maintenance teams rely on actionable work plans to minimize emergency repairs.
Philippe Jetté, Product Manager of Asset Investment Planning at IBM, explains:
"AIP [Asset Investment Planning] turns policy into a repeatable, auditable decision process – not a one‑off spreadsheet exercise."
By establishing clear policies, organizations can prevent site-specific shortcuts. Defining when to run assets to failure, maintain, refurbish, or replace ensures local conditions are considered without deviating from the standardized framework.
Governance should also address site-specific risks, including physical climate hazards. Tools like the Physical Climate Risk Appraisal Methodology (PCRAM) help organizations systematically evaluate risks such as floods, heatwaves, and extreme weather events, integrating these factors into their investment plans [3].
Lastly, moving from static annual budgets to a rolling planning cycle allows for continuous adjustment. By recalibrating portfolios quarterly – based on real-world failures, completed projects, and updated asset conditions – organizations can refine risk models and keep investment plans aligned with evolving circumstances [1].
Data Integration: The Foundation for Scalable Planning
Bringing asset data together in one place is essential to avoid blind spots that can derail accurate prioritization efforts. A centralized asset inventory forms the backbone of key activities like costing, inspections, and performance tracking [6][8].
For organizations managing assets across multiple regions, fragmented systems – like Enterprise Asset Management (EAM), Geographic Information Systems (GIS), and Enterprise Resource Planning (ERP) – must be linked into a single, unified system. This ensures everyone works from the same consistent framework [6][8].
While data quality improves over time, it’s important to start by focusing on the key factors influencing 80% of asset condition outcomes [1]. When detailed inspection data isn’t available, using fallback options like installation dates can help maintain progress [1]. This integrated approach lays the groundwork for standardizing inventories and leveraging digital tools effectively.
Standardizing Asset Inventories
A unified structure for asset data is critical for precise tracking across regions. The process starts with establishing a global location hierarchy that organizes data by Parent Organization, Site, Building, Floor, and specific Space or Room [5][7]. This hierarchy ensures assets can be easily located and analyzed regionally. Each asset should have a unique identifier, standardized naming conventions (e.g., RICS NRM 3 or Uniclass), and classification codes like SFG20 [7].
Consistency in condition and criticality scoring is equally important. Standardized scales, such as BS 8544 condition grades (A through FX), enable accurate benchmarking across portfolios [7]. Without these, inconsistent assessments can skew investment priorities. For example, the UK public sector estate, which includes over 300,000 properties, struggles with inconsistent asset registers that complicate planning [7]. To maintain data integrity, organizations should define ownership roles contractually, conduct regular data sampling, and enforce strict change control processes [7].
Using Existing Data and Digital Tools
There’s no need to start from scratch – existing inspection reports, survey data, and maintenance records provide a strong foundation for asset management. The key is integrating this information into a standardized format that supports better decision-making. Tools like IoT sensors, drones, and reality capture can add real-time data to the mix [6].
Organizations can implement a monthly "carbon close" to lock in emissions and asset data, ensuring automated validations and reproducibility [9]. Standardized file formats, such as Construction Operations Building information Exchange (COBie), make it easier to transfer data seamlessly between organizations and suppliers [7].
Adopting a uniform data model, like the Common Information Model (CIM), further enhances integration across asset management systems [8]. This allows stakeholders to access tailored views of the same data: executives can review portfolio risks, finance teams can plan cash flow, and maintenance teams can manage ongoing work schedules – all from a shared foundation [1]. Standardized digital data also feeds directly into risk assessments and scenario planning, enabling optimization strategies. Additionally, organizations using standardized information models can cut manual update errors by 50% [10].
Optimizing Investments Through Scenario Planning and Prioritization
Using consistent data and risk frameworks, scenario planning helps quantify the long-term effects of investment decisions. Simulation models allow organizations to evaluate different budgets, timelines, and sustainability goals side-by-side before committing resources. This approach shifts decision-making from static annual budgets to a more dynamic, evidence-based process.
Simulations show how incremental changes in capital expenditures (CapEx) influence long-term outcomes. For instance, a regional utility discovered that increasing its budget by 10% for targeted refurbishments reduced the total cost of ownership by 22%. On the flip side, cutting the budget by 10% added $4.3 million in costs over five years due to heightened risks from aging assets [1]. By making the costs of deferral visible, these models help stakeholders grasp the financial risks of underfunding critical projects.
Adopting a rolling planning method, where portfolios are updated quarterly based on recent data – such as work history, costs, and unexpected failures – keeps plans responsive [1]. Sensitivity analyses, which test variables like discount rates, Value of Lost Load (VoLL), and climate data, ensure priorities remain adaptable to future uncertainties [11]. This simulation-driven approach lays the groundwork for testing budgets and sustainability targets.
Testing Scenarios for Budget and Sustainability Goals
To test effectively, organizations need a lifecycle value framework that compares intervention strategies like running assets to failure, maintaining, refurbishing, replacing, or upgrading. This framework helps evaluate how budget levels and sustainability targets interact across an entire portfolio.
In July 2025, researchers at the Pacific Northwest National Laboratory (PNNL) conducted a study of 16 federal sites across six U.S. climate zones to identify net-zero strategies. The team, led by Amy E. Solana and Andrea R. Mott, used a multi-criteria analysis to balance emissions reductions with lifecycle costs and environmental justice. Their findings showed that 11 of the 16 sites could cut emissions to within 2% of net-zero using on-site strategies. Specifically, on-site carbon-free energy (CFE) reduced emissions by 51%, while energy efficiency measures contributed 19%. Interestingly, building electrification increased emissions by 4.4% in certain scenarios due to grid emission factors and site-specific conditions [12].
When modeling carbon reduction strategies, testing multiple pathways is essential. The PNNL study revealed that carbon sequestration and procured CFE accounted for 16% and 15% of emissions reductions, respectively. Meanwhile, fleet electrification and fuel switching had smaller impacts, contributing 1.3% and 1.6% [12]. These findings highlight the importance of portfolio-level planning, where challenges at one site (such as heavy fossil fuel reliance) can be offset by opportunities at another (like strong renewable energy potential) [12].
For organizations lacking detailed inspection data, using proxies like installation dates can keep planning on track while data quality improves. Scenarios must also be transparent, repeatable, and auditable to ensure prioritization logic can stand up to scrutiny from regulators, boards, and other stakeholders [1].
Managing Trade-Offs Between Competing Priorities
Investment decisions often involve balancing cost, risk, compliance, and sustainability. Multi-Criteria Decision Analysis (MCDA) offers a structured way to evaluate priorities that can’t easily be monetized, such as safety improvements or community impact [11][14]. On the other hand, Cost-Benefit Analysis (CBA) is ideal when outcomes can be quantified in dollar terms, enabling calculations like benefit-cost ratios (BCR) and net present value [11].
Here’s how these methods differ:
| Methodology | Use Case | Advantage |
|---|---|---|
| CBA | Financial justification and regulatory approval | Provides clear Benefit-Cost Ratios (BCR) for stakeholders [11] |
| MCDA | Balancing ESG, safety, and technical priorities | Includes non-monetary, intangible benefits [11][14] |
Both approaches rely on Probabilistic Risk Assessment (PRA), which calculates risk as the probability of a hazard event multiplied by its consequence [11]. This method helps weigh rare but severe risks (like catastrophic failures) against more frequent, lower-impact events (like routine maintenance). Comparing baseline performance with adjusted scenarios lets organizations measure the benefits of targeted investments by the reduction in risk consequences [11].
"A data-driven, long-term AIP process addresses all four challenges by linking asset condition and criticality to financial risk and service outcomes. It also turns policy into a repeatable, auditable decision process – not a one-off spreadsheet exercise." – Philippe Jetté, Product Manager, Asset Investment Planning, IBM [1]
To manage trade-offs effectively, organizations should establish a common value framework. This ensures that engineers, finance teams, and operations staff use consistent models to translate technical risks into financial and service outcomes [1]. Without this alignment, departments may prioritize conflicting objectives, missing the bigger picture. For example, if resilience goals exceed available budgets, breaking actions into smaller steps or revisiting previously discarded options can help [13].
Organizations that excel in prioritization treat it as an ongoing process. By using scenario optimization to test portfolios under various constraints – like limited resources or "unconstrained" budgets – they can identify the point of diminishing returns and the maximum achievable outcomes [1]. This iterative approach ensures investment decisions stay aligned with shifting business goals, regulatory demands, and sustainability commitments across all sites and regions. These insights set the stage for integrating sustainability metrics further into investment strategies.
Integrating Sustainability into Asset Investment Plans
Sustainability is now a core part of asset investment decisions. When managing asset planning across multiple sites, organizations need a clear system to measure carbon footprints, monitor energy performance, and meet ESG (Environmental, Social, and Governance) commitments. The real challenge lies in converting broad decarbonization goals into actionable, trackable steps at the portfolio level.
By embedding sustainability metrics into lifecycle value frameworks, organizations can treat carbon emissions and energy use as measurable costs, just like maintenance or replacement expenses. Those leading in this area rely on robust data systems, including versioned Factor Libraries and Methodology Libraries, to ensure traceability and consistency. Without this structure, emissions reporting becomes a manual, error-prone process that varies across regions.
"Systems and data are not an IT side project. They are the infrastructure that makes emissions measurable, initiatives verifiable, and claims defensible." – Umbrex Decarbonization Playbook [9]
To improve transparency, organizations can adopt a "monthly carbon close" process, similar to financial reporting. This approach finalizes inputs on a specific date, applies automated validations, and locks calculations [9]. Such discipline allows stakeholders to trace emissions changes back to their source, whether they stem from increased activity, improved efficiency, or methodology updates. Breaking reports into four clear drivers – Activity (production/occupancy), Intensity (efficiency), Mix (energy sourcing), and Methods (factors/boundaries) – makes it easier to analyze variances [9]. This approach ties together earlier data standardization efforts, linking sustainability and risk management within asset planning.
Calculating Carbon and Energy Impact
Accurately measuring carbon and energy impacts starts with standardized methods that work across diverse sites. The CalTRACK methodology, for example, provides a consistent way to estimate avoided energy use (AEU) using common data sources like utility meters and weather data [16].
"CalTRACK is a set of methods for estimating avoided energy use (AEU), related to the implementation of one or more energy efficiency measures, such as an energy efficiency retrofit or a consumer behavior modification." – CalTRACK Technical Documentation [16]
For commercial and multifamily buildings, the DOE Building Energy Asset Score offers a 10-point rating system. It pinpoints opportunities for efficiency upgrades using the EnergyPlus simulation engine, which predicts energy performance [17][18].
By aggregating site performance and calculating fractional savings uncertainty, organizations can account for regional differences in climate, grid emissions, and building types without skewing results [16]. Converting energy data into consistent units, like kWh or therms, ensures comparability across sites [16].
To improve data reliability, emissions should be classified into quality tiers – ranging from measured primary data to proxy estimates. This creates a roadmap for transparency and helps prioritize investment in low-confidence data areas [9]. Applying the 80/20 rule is practical here: focus on the factors driving 80% of emissions and address those first [1]. This approach avoids analysis paralysis and encourages action, even with imperfect data.
Once carbon and energy impacts are quantified, the next step is aligning these metrics with ESG requirements.
Aligning Investments with ESG Requirements
Tying sustainability metrics to ESG strategies transforms them into valuable tools for decision-making. A materiality-based approach ensures resources are directed toward the environmental and social issues most relevant to specific asset types and sectors [15][19]. Generic, one-size-fits-all checklists often overlook regional regulations, stakeholder priorities, and physical risks.
The GRESB Infrastructure Asset Assessment serves as a global ESG benchmarking framework, helping infrastructure companies track performance across energy use, greenhouse gas emissions, and other metrics [19]. Representing $8.8 trillion in real asset value and used by over 150 institutional investors managing $50 trillion in assets, GRESB has become a key standard for ESG reporting [20]. It aligns with international frameworks like the Task Force on Climate-Related Financial Disclosures (TCFD) and the Global Reporting Initiative (GRI) [19].
When reporting on multi-facility assets, organizations can either group them under a single assessment or report separately for each facility. While both methods are valid, separate reporting often provides better benchmarking by ensuring relevance within peer groups [15][19]. For portfolios, using standardized reporting boundaries is critical. Assets should only be grouped if they share centralized management and aggregated performance data [15].
To stay compliant, organizations should prioritize auditability and clear methodology control when choosing digital tools [9][15]. Separating "calculation logic" (how activities translate to emissions) from "reference data" (like factor libraries) simplifies updates and ensures transparency [9].
Quantifying the "cost of deferral" is another essential step. Delaying green upgrades can increase long-term risks and expenses [1]. For instance, a modest 10% budget increase for targeted refurbishments of high-risk units can cut total ownership costs by 22% over time while boosting reliability [1]. This evidence-based approach reframes sustainability as a risk management strategy that protects long-term value, rather than an added expense.
Implementing and Monitoring Scalable Investment Plans
After integrating sustainability metrics into your planning framework, the next step is all about execution and continuous refinement. The difference between a plan that looks good on paper and one that delivers results lies in how effectively you monitor performance, adjust to changing conditions, and maintain thorough documentation across all sites.
Organizations that approach asset investment planning as an ongoing process, rather than a once-a-year task, tend to achieve better results. Philippe Jetté, Product Manager for Asset Investment Planning at IBM, explains it clearly:
Plans evolve as real-world conditions change [1].
A rolling planning cycle of 12 to 18 months, updated quarterly based on real-world data like failures, work history, and resource availability, ensures that portfolios stay relevant [1]. This approach avoids the trap of making decisions at the start of the fiscal year only to see them lose relevance by the third quarter.
The ISO 55001:2024 standard now prioritizes "Predictive Action", which focuses on adapting plans to evolving risks and opportunities instead of rigidly sticking to preventive schedules [21]. For multi-site portfolios, this means creating feedback loops where data from completed maintenance and condition monitoring feeds directly into investment models [1][22]. For example, if a critical asset fails earlier than expected, that should prompt an immediate review of similar assets across other sites – no need to wait for the next annual planning cycle. These dynamic cycles support strong performance tracking and audit readiness, especially in multi-site environments.
Tracking Performance and Creating Feedback Loops
Establish measurable thresholds to ensure consistent escalation. For instance, you could set a rule that no asset at Condition Grade 5 can operate without a documented risk acceptance plan [22]. These thresholds remove subjective judgment and ensure automatic escalation of high-risk situations, regardless of who manages the site.
A live risk register plays a key role here. Unlike static spreadsheets updated annually, a live register captures real-time data on asset conditions, incidents, and shifting risk profiles [22]. This ensures alignment with the standardized asset inventories discussed earlier. Sakthi Thangavelu, Senior Manager at Glocert International, highlights:
If the [risk] register exists independently of decision-making, it adds no value [22].
Each risk should have a specific owner, a treatment plan, and a due date. Critical risks should be reviewed monthly, while medium and low risks can be assessed quarterly [22].
To ensure consistency across multiple sites, calibration workshops are essential. Representatives from all regions should work through the same examples to align on criticality scores and risk levels [22]. This avoids the common issue where "Critical" means one thing in Texas and something entirely different in California, leading to resource misallocation.
Combining Asset Investment Planning (AIP) with Asset Performance Management (APM) allows organizations to measure the impact of investments by comparing KPIs before and after interventions [23]. This creates a feedback loop where planned improvements are validated against actual performance, helping refine future planning. For instance, if a refurbishment was supposed to extend an asset’s life by five years but monitoring shows ongoing degradation, the model needs adjustment, and similar projects should be re-evaluated.
Maintaining Audit-Readiness and Compliance
Continuous performance tracking naturally supports audit-readiness by embedding traceability into every step of the planning process. Auditors expect to see a clear link between criticality assessments, risk registers, maintenance strategies, condition monitoring data, and capital investment decisions [22].
The Strategic Asset Management Plan (SAMP), simplified in the ISO 55001:2024 update, acts as the central document connecting asset objectives to broader organizational goals [21]. Approved by senior management, the SAMP should be referenced in major investment decisions to demonstrate strategic alignment. For multi-site portfolios, standardized condition grading is crucial. A 1–5 system (ranging from "Very Good" to "Very Poor") provides objective data that supports criticality assessments and optimizes investment timing [22]. Auditors will expect to see that Grade 5 assets prompt immediate action or documented risk acceptance.
Cross-functional validation further strengthens audit-readiness. Showing that teams from operations, maintenance, engineering, and safety contributed to assessments demonstrates that decisions were collaborative, not made in isolation [22]. Meeting minutes, sign-offs, and records of dissent and resolutions provide additional credibility to the process.
Integrated platforms simplify this by automatically generating the documentation auditors need, eliminating the hassle of piecing together decision rationales months later. When your investment decisions are transparent, well-documented, and aligned with both risk tolerance and strategic goals, compliance becomes a natural outcome of effective management rather than an added burden.
Conclusion
Scaling asset investment planning across various sites and regions doesn’t demand flawless data or unlimited budgets – it calls for a structured, risk-focused, and data-driven strategy that aligns environmental goals with financial performance. Organizations that excel in this area go beyond outdated age-based replacement schedules and disconnected spreadsheets. Instead, they adopt systems that connect asset condition, criticality, and climate risks to tangible business outcomes.
The framework shared earlier highlights the core principles for scalable planning. Start by standardizing your value framework to enable fair comparisons between different investments – whether it’s replacing a transformer in Texas or improving flood resilience in Florida. Prioritize the most critical risk factors using the 80/20 rule, and apply scenario planning to weigh trade-offs. Even small budget changes can significantly affect long-term ownership costs.
Establish rolling 12- to 18-month planning cycles, refreshed quarterly with updated data. Feedback loops are crucial – information from completed projects should feed back into your models to enhance accuracy over time. This isn’t a one-and-done task; it’s a continuous process that evolves alongside emerging risks and new opportunities.
When investment decisions are guided by clear, consistent risk evaluations, regulatory approvals become smoother, and stakeholder confidence grows. As Philippe Jetté, Product Manager for Asset Investment Planning at IBM, explains:
A data‑driven, long‑term AIP process… turns policy into a repeatable, auditable decision process – not a one‑off spreadsheet exercise [1].
This approach lays the groundwork for resilience, cost efficiency, and environmental responsibility across any asset portfolio.
FAQs
How do I start risk-based asset planning with incomplete data?
To get started, gather reliable and relevant data, such as condition assessments, maintenance records, and lifecycle schedules. Make sure to standardize how this data is collected across all sites to keep things consistent. Focus on high-risk assets and areas with gaps by using risk-based techniques and leveraging the data you already have. Add scenario analysis into the mix to assess potential risks and their impacts. Over time, work on improving the quality of your data through ongoing refinements, while sticking to a structured, risk-centered approach that supports effective planning, even with existing constraints.
What’s the best way to standardize risk and condition scoring across sites?
To ensure consistency in risk and condition scoring across multiple sites, it’s important to normalize risk scores to a shared scale, such as 0–10. A systematic method, like multiplying the probability of failure by the consequence of failure, can standardize evaluations. Using consistent rating systems and frameworks helps maintain uniformity and makes comparisons between locations straightforward. This approach not only simplifies decision-making but also aligns with broader goals for scalable asset planning.
How can I include carbon and energy impacts in investment prioritization?
To factor in carbon and energy impacts when prioritizing investments, evaluate how different strategies influence emissions, energy consumption, and associated risks. Analytical tools like multi-criteria decision analysis or cost-benefit analysis can help quantify advantages, such as lowering vulnerabilities or boosting operational efficiency. Focusing on investments that deliver lifecycle cost savings, enhance resilience, and align with environmental objectives ensures decisions are both data-driven and prepared for audits.
Related Blog Posts
- Infrastructure Asset Management: A Risk-Based Approach for Multi-Year CAPEX Planning
- Building Multi-Year Investment Scenarios in Days, Not Months
- From Data to Decisions: Turning Asset Analytics into CAPEX Savings
- Change Management for Asset Investment Planning: Getting Finance, Operations and ESG on the Same Page