


Starting an asset investment planning program is just the beginning. To ensure success, you need to track the right Key Performance Indicators (KPIs). These metrics provide actionable insights, helping you reduce costs, improve efficiency, and align with long-term goals. Here’s what you should focus on:
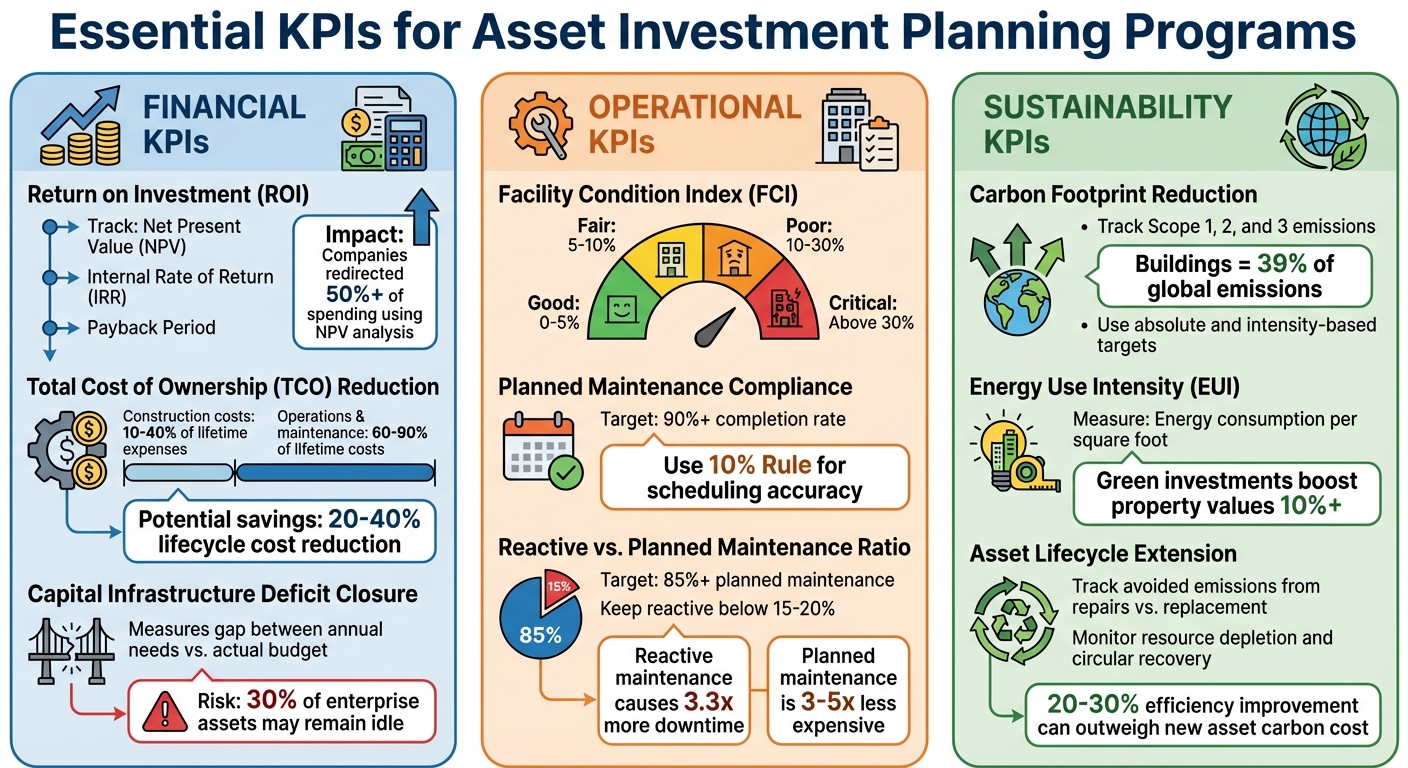
- Financial KPIs: Measure ROI, reduce Total Cost of Ownership (TCO), and close infrastructure budget gaps.
- Operational KPIs: Track Facility Condition Index (FCI), maintenance compliance, and proactive vs. reactive maintenance ratios.
- Sustainability KPIs: Monitor carbon footprint reduction, energy efficiency (EUI), and asset lifecycle extension.
Essential KPIs for Asset Investment Planning Programs
Asset Management Dashboards for KPIs, Metrics and Measures
sbb-itb-5be7949
Setting Up Your KPI Tracking System
To track KPIs effectively, you need a structured approach. This means organizing your data, establishing a clear starting point, and creating the infrastructure necessary to measure progress accurately.
Creating a Centralized Asset Data Inventory
Scattered data can make KPI tracking feel like navigating in the dark. If your asset information is spread across spreadsheets, CMMS tools, BIM files, and finance systems, you’re left with gaps that make portfolio-wide benchmarking nearly impossible [6][10]. The fix? A single, centralized repository that consolidates location data, condition assessments, maintenance history, energy performance, and lifecycle schedules for every site.
"A complete Asset Inventory provides the foundation for owners to track cost and performance of assets over time to make the right decision regarding the life-cycle of the asset." – APPA [10]
Using a hierarchical framework, like the CIBSE DE5T template, can help standardize how facilities, spaces, systems, and components are categorized [7]. This ensures consistency when comparing metrics like energy consumption or maintenance compliance across your portfolio. From the start, include metrics like the gap between intended and actual energy performance ratings, so you’re not scrambling to add environmental data later [7]. The inventory should also include key details like reliable identifiers, installation dates, power ratings, and maintenance history to support predictive capabilities [10][14].
Start with the data you have and refine it over time. As Benjamin Koczwarski from UrbanRe puts it:
"A spreadsheet is not a strategy. But when we combine data with clear processes and strategy – we get a system that helps us invest smarter" [11].
For critical assets, update condition data annually or biannually to keep predictive models accurate [6][9].
Setting Baseline Metrics
Before you can measure progress, you need to know where you’re starting. Establishing baseline metrics involves capturing initial measurements for lifecycle costs, energy use, carbon emissions, and operational performance before launching your program. Gather at least three months of historical data to account for anomalies and ensure your baseline reflects actual conditions [12].
Standardization is key here. Clearly document how each metric is calculated – like when the "clock" starts for repair time – to ensure comparisons remain consistent over time [12]. Focus on core data categories such as asset condition, maintenance history, energy and environmental performance, and lifecycle replacement schedules [6][8]. High-performing facilities often track just three to five critical KPIs instead of overwhelming themselves with dozens [12].
Use industry benchmarks to validate your baseline. For example, annual maintenance spending should typically fall between 2% and 5% of the total Replacement Asset Value (RAV). Preventive maintenance compliance in top-tier facilities often hits 90% or higher [12]. If your equipment’s annual maintenance costs exceed 6% of its replacement value, it might be time to consider replacing it rather than continuing repairs [12].
Once you’ve established your baseline metrics, integrate predictive models and ISO 55001 standards to stay ahead of asset performance challenges.
Using Predictive Models and ISO 55001 Standards
Predictive models can turn raw data into actionable insights. ISO 55001 provides a global standard for aligning organizational goals with risk-based asset management decisions [13]. Following this framework ensures your asset register is audit-ready and supports long-term site valuation.
"An effective asset management system translates the organization’s objectives into asset-related decisions, plans, and activities using a risk-based approach." – ISPE Good Practice Guide [13]
Predictive maintenance models leverage historical and real-time data to forecast asset failures, enabling you to shift from reactive "fix it when it breaks" strategies to proactive scheduling based on predicted wear and tear [6]. These models can guide capital planning and identify gaps through deterioration forecasts [15].
Advanced tools like IoT sensors and AI-driven analytics can automate defect detection and standardize condition scoring across multiple sites, reducing manual inconsistencies [6]. This creates a tracking system that doesn’t just report past performance but also helps you anticipate future challenges.
Financial KPIs to Track
Once you’ve established a solid data foundation, financial KPIs can help you quantify your program’s tangible impact. While predictive models and inventories lay the groundwork, tracking the right financial metrics demonstrates to stakeholders that your program isn’t just managing assets – it’s driving financial improvements.
Return on Investment (ROI)
Connecting financial metrics with risk-based asset management ensures investments yield measurable results while supporting long-term goals. A key starting point is calculating Net Present Value (NPV), which helps prioritize projects based on their ability to create value rather than focusing solely on upfront costs.
"Net present value is the bedrock of ROI estimates, but adding other factors to the analyses can help business leaders see how projects can advance corporate priorities beyond financial returns." – Chris Griggs, Kate Siegel, and Matt Banholzer, McKinsey & Company [17]
Tracking additional metrics like Internal Rate of Return (IRR) and Payback Period adds depth to project evaluations [1]. For example, in January 2025, a chemicals company assessed around 300 investment projects using NPV alongside other priorities like reliability and sustainability. This approach led them to redirect over 50% of their spending toward initiatives that boosted margins and supported growth simultaneously [17].
Real-time dashboards bring transparency by comparing forecasts with actual results. This keeps budgets under control and allows stakeholders to see how CAPEX and OPEX improvements translate into financial returns. Regular reviews ensure accountability by aligning forecasted benefits with actual outcomes.
While ROI focuses on value creation, reducing Total Cost of Ownership (TCO) highlights long-term efficiency.
Total Cost of Ownership (TCO) Reduction
TCO measures the full lifecycle cost of an asset – from acquisition through operations, maintenance, and eventual disposal [5]. This metric is essential because construction costs typically represent only 10% to 40% of an asset’s total lifetime expenses, with 60% to 90% stemming from long-term operational and maintenance costs [16].
"Capital expenditures typically account for just 10% to 40% of an asset’s lifetime costs; the other 60% to 90% of costs reside in long-term operations, maintenance, and other expenses." – BCG [16]
Tracking TCO in relation to asset replacement value can lead to significant cost reductions. Organizations that prioritize TCO during the planning phase have achieved lifecycle cost savings of 20% to 40% [16]. For instance, public infrastructure planners have cut lifecycle costs by 18% to 33% by improving coordination and streamlining maintenance activities [16].
Involving operations and maintenance teams early – during design and procurement – ensures practical requirements are addressed upfront. This avoids costly retrofits later and keeps long-term costs in check [16]. By monitoring lifecycle cost trends quarterly, you can identify inefficiencies early and fine-tune your strategy before they escalate into larger budget challenges.
Beyond individual asset efficiency, it’s critical to align spending with broader infrastructure needs.
Capital Infrastructure Deficit Closure
Aligning fiscal strategies with infrastructure needs is essential for minimizing risks and meeting long-term goals. The capital infrastructure deficit measures the gap between annual infrastructure needs and actual budget allocations. Tracking this metric ensures you stay on target financially while progressing toward strategic management goals, such as achieving optimal asset age and utilization rates [4].
"An integral part of this accountability involves performance measurement – the process by which program, service, project and/or asset outcomes are measured against intended objectives." – Capital Asset Management Framework Guidelines, British Columbia [4]
To calculate this, compare forecasted expenditures with actual budget allocations [1]. Establish realistic baselines and targets that encourage adherence to budgets [4]. A systematic review process can then evaluate variances and uncover the causes behind budget gaps [4].
Inefficiencies can arise when assets are underutilized – nearly 30% of enterprise assets may remain idle due to poor visibility and ownership, tying up capital and dragging down productivity [5]. Regularly tracking deficits helps identify these inefficiencies, enabling resource reallocation to bridge the gap between infrastructure needs and available funding.
Operational and Risk Management KPIs
Operational indicators bring real-time clarity to asset performance and risk, offering a critical layer of insight that builds on financial metrics. By identifying risks and assessing maintenance effectiveness, these metrics help create a well-rounded approach to asset management.
Facility Condition Index (FCI)
The Facility Condition Index (FCI) provides a straightforward way to assess the health of an asset. It’s calculated by dividing deferred maintenance costs by the asset’s current replacement value. The results are categorized into benchmarks: Good (0–5%), Fair (5–10%), Poor (10–30%), and Critical (above 30%) [20][21][22]. Assets with an FCI above 30% often require significant intervention or even replacement. Monitoring this metric quarterly is key; any upward trend indicates deferred maintenance is outpacing efforts to address it.
"FCI transforms subjective facility assessments into objective, comparable data. Instead of relying on opinions about which buildings ‘look worse,’ facility managers can prioritize capital investments using a risk-based approach." – AssetLab [20]
Once the condition of assets is evaluated, tracking maintenance schedules ensures operational reliability stays on course.
Planned Maintenance Compliance
Planned Maintenance Compliance measures how effectively tasks are completed on time, reflecting both planning and resource management [12][19]. Top-performing facilities aim for compliance rates of 90% or higher [12]. To measure this accurately, use the 10% Rule – tasks should be completed within plus or minus 10% of the scheduled interval (e.g., a 30-day task should be completed within three days of the target date).
For example, in 2024–2025, Cardinal Glass boosted its on-time work order completion rate by around 14% year-over-year by adopting mobile-first digital systems. These systems reduced technician travel time and improved response efficiency [19]. Tracking compliance separately for critical and non-critical assets can further highlight specific reliability trends.
Reactive vs. Planned Maintenance Ratio
This ratio measures whether your team is focused on proactive vs. reactive maintenance and the associated costs. The Planned Maintenance Percentage (PMP) calculates the share of total maintenance dedicated to scheduled tasks versus unscheduled repairs [12].
"A high PMP means your team controls the work. A low PMP means the work controls your team." – Billy Cassano, Applications Engineer, Tractian [24]
Strive for a PMP of 85% or higher, keeping reactive maintenance below 15–20% of total efforts [19][23]. Reactive maintenance often leads to 3.3 times more downtime and 16 times more defects [19]. Additionally, planned maintenance is typically 3 to 5 times less expensive than reactive fixes [23].
For instance, Ahlstrom achieved a 90% reduction in Mean Time to Repair (MTTR) in its first year of implementing structured maintenance tracking, cutting monthly MTTR from 580 hours to just 60 [19]. If reactive maintenance starts to dominate, investigate potential causes like approval delays, inventory shortages, or aging assets. Addressing these issues can help shift the focus back to proactive maintenance, significantly improving asset performance.
Sustainability and Environmental KPIs
Beyond just financial and operational metrics, sustainability KPIs reveal how investment decisions shape environmental outcomes. These metrics assess whether your portfolio is effectively reducing emissions and improving resource efficiency. They link day-to-day actions to broader climate goals, offering a clear picture of your environmental impact.
Carbon Footprint Reduction
Cutting carbon emissions involves two key strategies: absolute emissions targets and intensity-based targets. Absolute targets track the total amount of greenhouse gases reduced compared to a baseline year, making them ideal for portfolios with a consistent number of assets[3]. On the other hand, intensity targets measure emissions relative to a business metric – like emissions per square foot (MTCO2e/sq. ft.) – allowing for comparisons even if your portfolio changes in size[3].
"Setting a meaningful emissions reduction target requires taking into account and communicating how these two relevant and largely complementary dimensions of a target will vary in the future: your absolute emissions and some meaningful physical indicator of your carbon efficiency." – Pedro Faria, Technical Director, CDP[3]
For example, in a portfolio of 10 properties totaling 2,000,000 sq. ft., with a baseline of 6,000 MTCO2e, achieving a 50% intensity reduction would mean reaching 0.0015 MTCO2e per sq. ft. by the target year[3]. To track progress, monitor emissions across Scopes 1, 2, and 3: Scope 1 covers on-site fuel use, Scope 2 includes emissions from purchased electricity, and Scope 3 accounts for emissions from supply chains, employee commutes, and other indirect sources[2]. With buildings responsible for 39% of global emissions, these metrics are essential for driving meaningful change[3].
When using absolute targets, adjust baseline emissions after significant acquisitions or divestments. Without these recalibrations, selling assets could create the false appearance of progress, masking the need for actual efficiency improvements[3].
Energy Performance Improvements
Energy Use Intensity (EUI), which measures energy consumption per square foot, is a key metric for comparing efficiency across various building types and sizes[26]. For accuracy, normalize EUI data for factors like weather, occupancy, and production levels[26].
Breaking down energy consumption by system – such as HVAC, lighting, and water heating – provides actionable insights. The Department of Energy’s (DOE) Asset Score uses a 10-point scale to assess building systems based on predicted source EUI, which includes the energy needed for fuel generation and transmission[25].
Using centralized tools to gather utility bills and maintenance records can quickly highlight areas for improvement[26]. Additionally, monitoring utility rate structures can uncover opportunities for cost savings, like incentives for reducing demand below certain thresholds[26]. Investing in energy-efficient buildings not only lowers environmental impact but can also boost property values by over 10% – a win for both sustainability and profitability[26].
Asset Lifecycle Extension
Lifecycle KPIs ensure that environmental goals align with long-term asset performance. Extending an asset’s lifespan reduces environmental harm by avoiding the carbon emissions tied to new production. For some equipment, the carbon footprint of manufacturing and transport can outweigh the energy savings of replacing it with a newer model[14]. Avoided emissions – the greenhouse gases saved by repairing and maintaining assets instead of replacing them – quantify this benefit[14].
"The cheapest choice on a three-year budget horizon can be the worst when viewed over a 15‑year lifecycle, especially once carbon and regulatory risks are taken into account." – Nextbitt[14]
Metrics like resource depletion track the consumption of metals, minerals, and fossil fuels, while circular recovery and residual value measure the percentage of materials that are recovered, resold, or refurbished at the end of an asset’s life[14]. By extending asset lifespans, you reduce the demand for raw materials and lower the extraction rates needed for new production[14].
To make informed decisions, compare the total expected emissions of an existing asset against the combined embodied and operational carbon of a potential replacement. Often, improving an asset’s efficiency by 20–30% can outweigh the carbon cost of manufacturing a new one over a 10–20-year service life[14]. Establish clear thresholds where extending an asset’s life provides both carbon and cost savings, ensuring consistent decision-making across your portfolio[14].
Using Oxand Simeo™ for KPI Tracking

Once your asset investment planning program is up and running, keeping a close eye on your KPIs becomes essential. Oxand Simeo™ simplifies this task by pulling together data from various sources – like CMMS systems such as SAP or Maximo, BIM models, IoT sensors, and field inspections – into one easy-to-access platform. This unified approach gives infrastructure and real estate managers a clear view of key financial, operational, and sustainability metrics, perfectly complementing the risk-based investment strategy discussed earlier.
By centralizing data, Oxand Simeo™ makes KPI tracking more efficient, offering real-time visual insights that make decision-making faster and more informed.
Real-Time Dashboard for KPI Monitoring
Simeo™ takes advantage of Qlik-powered analytics dashboards to deliver real-time KPI visualizations. These dashboards transform raw data into actionable insights, with customizable widgets that track metrics like the Facility Condition Index (FCI), Total Cost of Ownership (TCO), ROI, and carbon footprint reductions – all updated live. For instance, you can configure alerts to flag when FCI exceeds 5%, triggering a red status and a prompt for immediate action. The platform is tailored for U.S. standards, displaying costs in $USD (e.g., $1,234,567.89), energy use in kBtu/sq. ft., and dates in the MM/DD/YYYY format.
Using the Simeo™ Go mobile app, field teams can sync inspection data directly to the cloud, cutting data collection time by 50% compared to traditional paper methods[28]. This ensures that dashboards reflect the most current conditions. Features like interactive maps and trend lines help identify patterns – such as declining energy efficiency or increasing reactive maintenance – before they turn into costly problems.
Scenario Testing and Optimization
Oxand Simeo™ goes beyond just monitoring; it also supports proactive planning with its scenario testing tools. The Scenario Simulator allows you to explore "what-if" scenarios to fine-tune your investment strategies. You can input variables like budget constraints, maintenance schedules, or carbon reduction targets, then use its extensive proprietary dataset to simulate outcomes[28][29]. For example, you could evaluate whether extending asset lifecycles from 50 to 75 years might lower TCO by 30%, or analyze how deferring maintenance could impact FCI and ROI over the next decade.
The Dynamic Planner feature adds flexibility, letting you drag and drop to adjust timelines, costs, and priorities as circumstances evolve. You can also stress-test budgets against risk thresholds and sustainability goals to find the best course of action. One public sector asset director shared that Simeo™ helped them cut their maintenance backlog by 27% and save $4 million in energy costs across 66 buildings within a single budget cycle[28]. By running quarterly simulations, you’ll be better prepared to adapt to shifting executive priorities or sudden budget changes, ensuring your KPIs remain on track.
Adjusting KPIs Over Time
Your asset investment planning program isn’t a "set it and forget it" process. Market conditions shift, budgets fluctuate, and new technologies emerge – any of which can render your current KPI targets outdated. Regularly reviewing and adjusting your metrics ensures they stay aligned with your organization’s changing goals. It also helps you catch and address potential issues early, before they grow into larger problems. This ongoing refinement is essential for keeping your strategy effective.
Regular KPI Review Cycles
The timing of your KPI reviews should align with what you’re measuring. For most organizations, monthly reviews strike the right balance. They provide enough data to identify trends without overwhelming your team with constant updates [19]. However, for high-stakes operational metrics like equipment downtime or work order completion rates, weekly or even daily monitoring may be necessary to catch problems as they arise [19].
When it comes to strategic planning, quarterly reviews work best. These sessions should focus on big-picture goals, such as lifecycle milestones, budget alignment, and whether your three-year investment plan still makes sense [30]. Additionally, schedule Post-Implementation Reviews (PIRs) for major capital projects. Conduct these reviews 6 to 18 months after project completion to assess whether the outcomes match your initial business case assumptions [4].
Threshold Alerts and Plan Updates
Regular review cycles are just one part of the equation. Setting dynamic thresholds can turn your data into a proactive management tool. For example, if a KPI like Planned Maintenance Percentage drops below 85%, an automated alert can signal the need for immediate action [19]. These alerts act as early warnings, prompting you to investigate issues and make adjustments before performance declines further.
It’s crucial to keep these thresholds relevant. External changes – like budget cuts, new regulations, or shifting priorities – may require you to recalibrate your KPI targets. The Measure–Perform–Review–Adapt (MPRA) framework is a helpful guide for this process [18]. When evaluating thresholds, ask whether they are still realistic, whether they encourage the right behaviors, and whether they can withstand external scrutiny [4]. If a target becomes unattainable or no longer serves its purpose, it’s time to update it.
Adjusting KPI thresholds as conditions change ensures your resources are used wisely and that your strategic goals remain achievable. By keeping your metrics current, your asset investment planning stays in step with market realities and long-term objectives.
Conclusion
Tracking the right KPIs transforms your asset investment program into a system of continuous improvement. By focusing on metrics like ROI and TCO, you can shift from reactive to proactive repairs, potentially cutting ownership costs by up to 30% [27]. Sustainability metrics, such as carbon footprint and energy use intensity, help ensure alignment with decarbonization goals and regulatory standards, while upfront green investments can boost property values by over 10% [2]. Risk management metrics further refine your strategy, guiding investments to areas where they prevent costly failures and maximize value.
The real challenge lies not in gathering data but in converting it into actionable insights. This principle is at the heart of every metric discussed. For instance, nearly 85% of SAP users rely on spreadsheets for capital planning, often leading to outdated information and fragmented decision-making [1]. Oxand Simeo™ addresses these gaps by centralizing asset data into one platform, offering real-time dashboards, predictive maintenance forecasts, and scenario testing that considers budget, risk, and carbon constraints. As one CEO from Oxand explained:
"We needed a tool that would allow us to consolidate the fragmented data we had and project it in a way that could be clearly presented to our elected officials, who are the decision-makers."
- Chief Executive Officer (General Director of Services), Oxand [27]
Organizations often see improvements in reliability and cost efficiency within 6–8 months of adopting predictive maintenance and lifecycle planning [27]. The secret is treating KPI tracking as a dynamic process, not just a static report. Regular updates, threshold alerts, and scenario simulations empower teams to adjust strategies as assets age, budgets evolve, or new regulations arise. By keeping metrics current and plans flexible, you lay the groundwork for long-term financial health, operational resilience, and sustainable infrastructure.
FAQs
Which KPIs should we track first after launch?
Start by keeping an eye on predictive maintenance metrics, such as equipment performance and failure rates. Pair these with financial indicators like ROI and cost efficiency. Together, these KPIs offer a clear view of how well your assets are performing and whether your investments are paying off. This information is crucial for making smarter decisions and fine-tuning your program.
How do we set KPI baselines with limited data?
Setting KPI baselines when data is limited can feel challenging, but it’s all about starting with what you have. Begin by pinpointing the key metrics that are most relevant to your assets. Even sparse historical data can serve as a foundation for creating preliminary benchmarks. If historical data isn’t sufficient, you can turn to industry standards, expert opinions, or even proxy data to establish a starting point.
As your program progresses and more data becomes available, revisit and refine these benchmarks. The goal is to ensure that your KPIs stay realistic and aligned with the objectives of your program.
How often should KPI targets and thresholds change?
KPI targets and thresholds should be reviewed and updated at least once a year. This regular review helps ensure they remain aligned with changing goals, market trends, and asset performance. Keeping them up-to-date ensures they stay relevant and effective in driving ongoing improvement.
Related Blog Posts
- How to Calculate the Real ROI of Predictive Maintenance (and Feed It into Your Investment Plan)
- From Data to Decisions: Turning Asset Analytics into CAPEX Savings
- Building the Data Foundation for Predictive Maintenance and Investment Planning
- Scaling Asset Investment Planning Across Multiple Sites and Regions