


Managing assets without a clear plan leads to wasted budgets, unexpected failures, and missed opportunities. In just 90 days, you can shift from reactive maintenance to a data-driven asset investment strategy that saves money, reduces risks, and improves decision-making. This guide walks you through a three-phase process:
- Phase 1 (Days 1–30): Assess your current assets, establish a condition rating system, and gather accurate data to identify high-priority needs.
- Phase 2 (Days 31–60): Build a centralized asset register, prioritize maintenance based on risk, and align decisions with long-term costs.
- Phase 3 (Days 61–90): Use scenario modeling to create multi-year investment plans, link maintenance data to financial goals, and prepare audit-ready documentation.
Organizations that follow this approach report average savings of $2.1 million annually, extend asset life by 40%, and improve grant approval rates by 2–3x. Ready to move from crisis management to smarter asset planning? Let’s dive in.
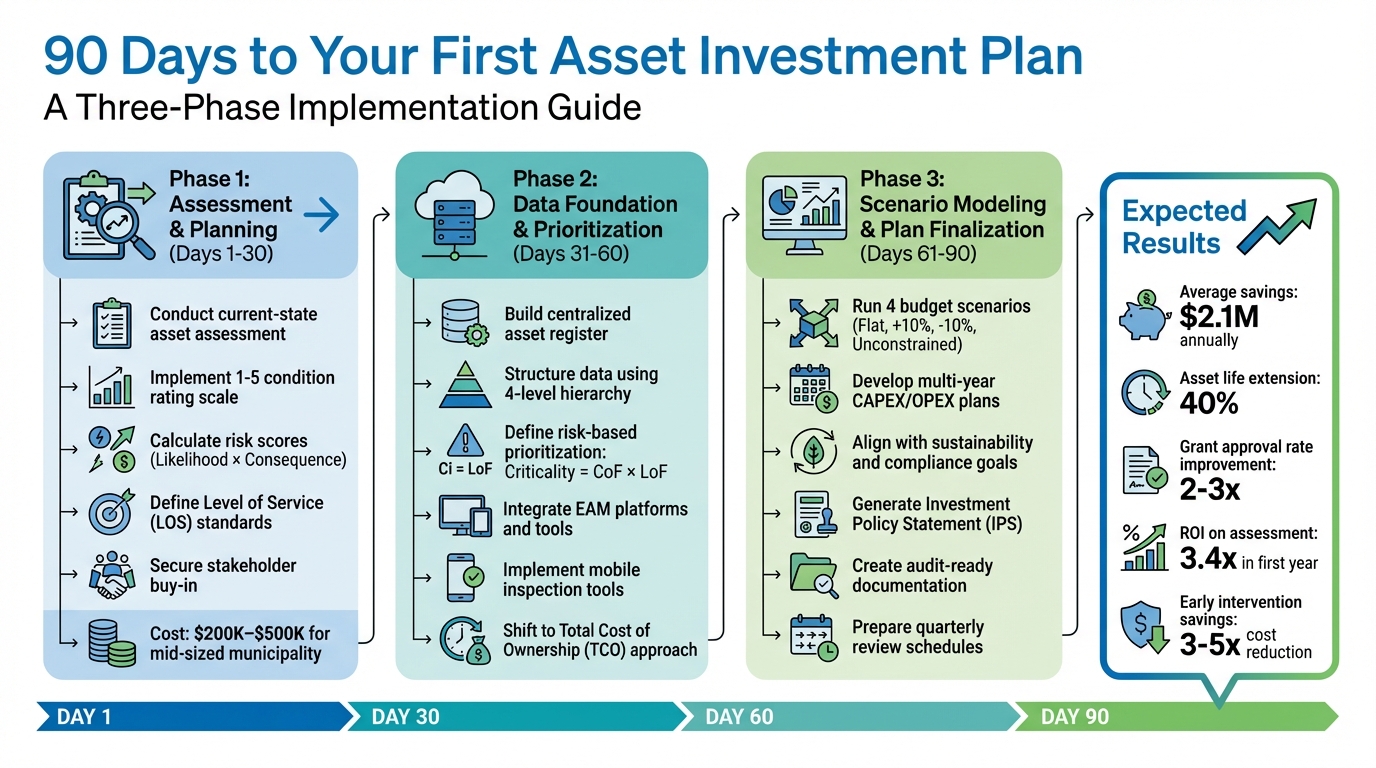
90-Day Asset Investment Plan Implementation Timeline
Linking Investments to Strategy with Asset Investment Planning
sbb-itb-5be7949
Phase 1: Assessment & Planning (Days 1–30)
The first 30 days are all about laying the groundwork. This means evaluating what assets you have, understanding their condition, and identifying who needs to be part of the decision-making process. The goal is to establish a solid foundation for smarter, more strategic investments.
Conduct Your Current-State Asset Assessment
Start by reviewing your asset inventory. Confirm details like location, installation date, material, size, manufacturer, and expected lifespan. If you’re using a computerized maintenance management system (CMMS), ensure the data is complete and up-to-date. Alarmingly, 67% of municipalities lack thorough condition assessments [5], meaning many begin with incomplete data.
To fill in the gaps, send teams to collect missing information and implement a standardized 1–5 condition rating scale (from Excellent to Critical) for all asset categories. This scale simplifies complex engineering evaluations into a single, easy-to-understand number for leadership and finance teams. After condition ratings are assigned, calculate risk scores by combining the likelihood of failure with the potential consequences (social, financial, and environmental impacts) [5][7].
Focus your efforts on high-consequence assets first – like water mains, sewer systems, bridges, and critical facilities. A mid-sized municipality (population 50,000–100,000) typically spends $200,000–$500,000 for a comprehensive first-round assessment [5]. To manage costs, use a hybrid approach: hire consultants for specialized inspections, such as CCTV sewer surveys ($3–$8 per linear foot) or bridge inspections ($2,000–$8,000 per structure), while relying on in-house staff for routine condition scoring during regular maintenance [5].
In 2021, MGM Resorts International worked with Schneider Electric to audit over 17,000 assets across 100 million square feet of infrastructure. By assessing air handlers, chillers, pumps, and kitchen equipment, they transitioned from reactive maintenance to proactive, risk-based planning [6].
"The gap between municipalities that invest infrastructure dollars wisely and those that waste them on political priorities is almost always… a systematic asset condition assessment program." – Taylor, Oxmaint [5]
Acting early can save significant costs. Repairs for assets in "Critical" condition can cost 3 to 5 times more than addressing them in a "Fair" state [5]. The data you gather now will help avoid expensive, last-minute replacements later.
Once you’ve collected accurate condition data, you can set clear performance benchmarks and prioritize investments.
Define Scope and Objectives
With your assessment complete, the next step is to define measurable goals for your investment plan. Start by setting Level of Service (LOS) standards – these are the target performance levels for your systems, such as emergency response times or overall reliability [7]. These standards should align with your organization’s mission and service goals.
Use standardized tools like the Facilities Condition Index (FCI) or Facilities Quality Index (FQI) to measure the gap between your current state and desired outcomes [9]. Establish specific thresholds that trigger action. For instance, if an FCI score exceeds a certain level, it might automatically prompt a capital planning review. This creates a repeatable, data-driven framework for decision-making.
Plan with lifecycle optimization in mind. The goal is to intervene when assets are at a mid-level condition (typically Rating 3) to prevent costs from ballooning. For example, in February 2026, a city with 120,000 residents used condition data to reallocate $4.2 million in capital improvement funds. By identifying water mains at "Condition 2" with a 73% failure probability, the city prioritized replacing critical pipes over less urgent projects, avoiding a major failure during a freeze event [5].
Your objectives should also include compliance with regulations, such as GASB 34, EPA consent decrees, or ADA standards. Align these goals with governance processes to ensure proactive and decisive action.
Secure Stakeholder Buy-In and Governance
Data alone won’t push projects forward – you need stakeholder support and clear governance. Replace anecdotal budget requests with data-backed reports, using dashboards, maps, or digital twins to present risks and priorities clearly [11]. The standardized 1–5 rating system helps non-technical stakeholders, like council members or investors, quickly grasp the urgency of issues [5].
"The moment condition assessment data transformed our operations wasn’t when we completed the first round of inspections – it was when we used that data to defend a CIP reallocation to the city council." – Director of Engineering, City of 120,000 residents [5]
Establish governance by defining roles, responsibilities, and decision-making authority. Tie the asset management process to your organization’s annual planning and budget cycles [10]. Use deterioration curves to illustrate the "cost of delay" – showing how intervening at a "Fair" condition (Rating 3) is far more cost-effective than waiting until an asset reaches "Critical" condition. Delayed repairs can cost 3–5 times more [5], making a strong case for proactive investment. Standardized checklists and photo documentation can further build trust in the data and the decisions based on it [5].
Phase 2: Data Foundation & Prioritization (Days 31–60)
After completing your assessment and aligning with stakeholders, the next 30 days are all about laying a solid data groundwork and setting clear priorities for investments. This phase transforms raw data into a system that links immediate maintenance needs with long-term capital planning.
Een gecentraliseerd activaregister opzetten
Start by creating a gecentraliseerd activaregister to bring together data from CMMS, spreadsheets, BIM files, IoT sensors, and financial systems into one cohesive system – your enige bron van waarheid [11]. Without this, you risk blind spots, missed maintenance opportunities, and expensive emergency repairs.
Structure the register using a four-level hierarchy: Facility, Space, System, and Component [13]. This lets you drill down from big-picture portfolio decisions to specific asset actions. For example, instead of just tracking "HVAC", you’d organize it as Building A → Floor 2 → HVAC System → Air Handler Unit #3.
To standardize your data, use classification codes like Uniklasse, RICS NRM 3, of SFG20, and assign unique asset identifiers. Link assets to spatial references like the Unique Property Reference Number (UPRN) for consistency across large portfolios [14]. This is especially important for managing extensive estates, such as the UK public sector’s 300,000+ properties [14].
Focus on essential data points first – asset type, location, condition, and value – and refine over time [12]. Add duurzaamheidscijfers early on, such as energy performance ratings (EPC/DEC), refrigerant types, CO₂ reduction targets, and waste management processes [13][14]. Since operating costs over an asset’s lifecycle far exceed its purchase price, having detailed registers can significantly lower long-term expenses [13].
Ensure data quality with regular checks, automated validations, and strict change controls [14]. Use an electronic system integrated with CAFM software for real-time updates and audits [13]. If third-party vendors handle your data, contractually secure ownership to maintain control when agreements end [14].
Once your data is consolidated, the next step is prioritizing assets based on risk.
Define Risk-Based Prioritization Criteria
Leverage the condition data gathered in Phase 1 to prioritize assets using a simple formula: Criticality = Consequence of Failure (CoF) × Likelihood of Failure (LoF) [15]. This ensures your resources go toward the assets that need it most instead of being spread too thin.
Gevolgen van falen should be evaluated across five areas: Safety (risk of injury), Environment (pollution or damage), Operations (service disruption), Financial (repair or replacement costs), and Reputation (public or regulatory scrutiny) [15]. For instance, a water main break in a hospital district has far greater consequences than one in a less critical area. Use tools like SFG20’s Red/Amber/Green system to rank assets by their impact on operations and safety [14].
Kans op mislukking depends on factors like asset age, condition, operating environment, and maintenance history [15][7]. This is where your condition ratings become indispensable. Municipalities that switch from age-based to condition-based replacements report an average 40% savings on capital costs [5].
Shift your focus from short-term CAPEX/OPEX budgets to Totale eigendomskosten (TCO), which considers acquisition, maintenance, failure costs, and decommissioning [15][2]. Align your risk prioritization with sustainability goals – improving energy efficiency by 20–30% for high-energy assets can often outweigh the environmental impact of replacing them over a 10–20 year span [2].
"The cheapest choice on a three-year budget horizon can be the worst when viewed over a 15-year lifecycle, especially once carbon and regulatory risks are taken into account." – Nextbitt [2]
Set clear risk tolerance thresholds, such as "No asset with a residual risk score >15 is acceptable", to guide mandatory investments or replacements [15]. Involve cross-functional teams from operations, safety, finance, and maintenance in criticality assessments to ensure comprehensive evaluations [15]. Use a risk-cost ratio to focus on investments that deliver the greatest risk reduction per dollar spent [15].
"If you get criticality right, many other decisions follow naturally." – Sakthi Thangavelu, Senior Manager – Cyber Assurance, Glocert International [15]
With priorities in place, the next step is adopting tools to streamline decision-making.
Integrate Tools and Frameworks for Decision-Making
Use advanced tools to turn your asset data and risk criteria into actionable plans. Enterprise Asset Management (EAM) platforms centralize data to balance cost, risk, and performance across an asset’s lifecycle [17][18]. Many modern platforms even use AI to "bundle" nearby or related projects, reducing costs and minimizing disruptions [17].
Predictive models and digital twins can simulate asset aging and condition, helping you schedule interventions at the right time [5][11]. These models are especially useful when IoT sensor coverage is incomplete or too expensive. Some platforms use proprietary algorithms to predict deterioration across thousands of asset types, pinpointing the optimal time for repairs or replacements.
Mobile inspection tools can also streamline data collection. These tools allow staff to capture standardized condition ratings, photos, and GPS coordinates directly into your CMMS, ensuring consistency [5][11].
For sustainability-focused decision-making, frameworks like the GRESB Infrastructure Asset Assessment help benchmark your projects against ESG standards [16]. These frameworks highlight which environmental, social, and governance issues are most relevant to your sector and location, guiding your project priorities [16].
Adopteer een hybrid assessment model: use specialized consultants for complex inspections (e.g., CCTV sewer surveys at $3–$8 per linear foot or bridge inspections at $2,000–$8,000 per structure), while training in-house teams to handle routine condition scoring during regular maintenance [5]. Refresh your asset condition data on a set schedule – annually or biannually – and monitor high-risk systems in real time [11].
Phase 3: Scenario Modeling & Plan Finalization (Days 61–90)
The final stretch of this process focuses on transforming asset data into actionable investment plans. This phase ties financial strategies to sustainability goals and produces documentation that’s ready for audits.
Develop Multi-Year CAPEX and OPEX Scenarios
Scenario modeling bridges the gap between asset conditions, financial risks, and service outcomes. It’s where policy transforms into a structured, repeatable decision-making process. Using modeling tools, you can test scenarios within realistic budget and resource limits [4].
Run four key scenarios to evaluate reliability, risk, and total cost of ownership (TCO):
- Flat budget scenario: Establishes a baseline, balancing short-term reliability and long-term risks.
- Increased budget (+10%): Highlights potential optimizations and TCO reductions.
- Decreased budget (-10%): Reveals the cost of deferring interventions, including heightened risks and financial burdens.
- Unconstrained scenario: Explores the upper limits of performance and identifies where additional investments yield the greatest returns.
The outcomes of these scenarios often paint a clear picture. For example, increasing the budget by 10% for targeted refurbishments of high-risk assets could reduce TCO by 22% over time. On the flip side, cutting the budget by 10% might lead to increased risks and maintenance costs, potentially adding $4.3 million in TCO over five years compared to a flat budget [4].
"Asset investment planning is the ongoing practice of deciding, over a medium to long-term horizon, how to allocate capital and resources to minimize total lifecycle costs and risks." – Philippe Jetté, Product Manager, Asset Investment Planning, IBM [4]
For each group of assets, consider strategies like running to failure, maintaining/refurbishing, replacing, or upgrading. Use modeling to bundle similar assets, which can help capture economies of scale [4]. Track the condition of your network, backlog needs, and deferred funding requirements across all scenarios [10].
Focus your data efforts where they matter most. The 80/20 rule applies here: prioritize the factors driving 80% of asset condition effects, like operating environments, over less impactful data points like installation dates [4]. Adopt a rolling planning approach, recalibrating your portfolio quarterly based on real-world failures, costs, and resource availability [4].
By leveraging these scenarios, you can turn risk assessments into informed investment decisions that align with financial and sustainability goals.
Align Investments with Sustainability and Compliance Goals
Once financial scenarios are in place, the next step is to align them with broader goals like regulatory compliance and sustainability. Incorporate carbon reduction targets, energy performance metrics, and compliance standards into your multi-year plans (spanning at least 10 years [20]). Accurate asset data, established in earlier phases, plays a crucial role in this process.
Routine maintenance can significantly extend asset life, delaying costly and carbon-intensive renewals [19]. Use multi-criteria analysis (MCA) to evaluate investment options based on both financial and non-financial goals, such as social outcomes and environmental impact. Define clear performance targets and maintenance thresholds that align with regulatory standards and desired service levels.
Scenario analysis can also show how budget restrictions affect asset performance and sustainability targets over time. Cross-asset prioritization helps allocate funds effectively, balancing risk, cost, and performance. Decision Support Systems (DSS) that integrate condition monitoring data with predictive models can enhance compliance tracking and decision-making.
"Lifecycle plans should be prepared for a period of at least 10 years." – PIARC [20]
This approach ensures efficient resource use and adherence to ISO 55000 principles, which emphasize strategic, customer-focused asset management.
Genereer documentatie die klaar is voor controle
Creating an Investment Policy Statement (IPS) is critical. This document lays out your goals, risk tolerance, asset allocation strategies, and decision-making rules [23]. It serves as a guiding framework, especially during budget shifts or changing priorities.
"An Investment Policy Statement is a written plan that outlines your goals, risk tolerance, asset allocation targets and investment rules." – SmartAsset [23]
Your documentation should explain the reasoning behind asset allocation and risk mitigation strategies, not just list actions. This level of detail supports ISO 55001-compliant reporting [21]. Include key elements like asset valuations, performance gap analyses, and the logic behind specific recommendations to show alignment with long-term objectives [21].
Maintain comprehensive records of decisions, recommendations, and meeting notes to avoid miscommunication. Establish a clear communication protocol with regular review schedules (quarterly or semi-annual) and procedures for urgent decisions [21].
Show precise variances between actual and target allocations, both in percentages and dollar amounts [22]. Generate performance reports that summarize strategy outcomes, compare them against benchmarks, and document rebalancing efforts [21][23]. Quality documentation helps stakeholders understand the impact of underfunding, such as deferred maintenance or declining asset conditions [20].
Interestingly, clients who grasp the logic behind their plans are 67% more likely to stick with their strategies during market volatility. Moreover, 78% of clients who establish clear communication patterns in the first three months maintain professional relationships for over five years [21].
Connect Maintenance Data to Long-Term Investment Planning
Once you’ve established a solid data foundation, it’s time to shift gears from reacting to problems as they arise to planning ahead. By linking maintenance records with long-term investment strategies, you can transform routine upkeep into a proactive plan that reduces costly failures and extends the life of your assets.
Stop replacing assets just because they’re old. Instead, adopt a standardized 1–5 rating system. This system translates technical observations into clear, actionable financial data, allowing you to compare assets across your portfolio. By quantifying asset condition, this approach helps you time investments more effectively.
Why does timing matter so much? The costs of intervention skyrocket when you wait too long. Addressing an asset in "Fair" condition (Rating 3) can cost 3–5 times less than waiting until it reaches "Critical" failure (Rating 1) [5]. Take one municipality as an example: they avoided a catastrophic failure by reallocating millions of dollars, achieving a 3.4x return on investment for their assessment program in just the first year [5].
Modern CMMS platforms are game-changers here. These systems let you monitor asset health in real-time and update Remaining Useful Life (RUL) calculations with every inspection or work order [5][11]. When you combine this operational data with financial systems, you can create Capital Improvement Plans (CIPs) that adapt based on actual performance. For instance, well-performing assets can stay in service longer, while underperforming ones can be replaced sooner [8]. Municipalities using this strategy save an average of $2.1 million annually, while structured asset management programs extend asset lifecycles by 40% [1]. This kind of integration paves the way for precise risk assessments and smarter capital investments.
How do you prioritize investments? Calculate risk scores by multiplying the likelihood of failure by its potential consequences – whether social, financial, or environmental [5]. This ensures that high-stakes assets, like critical water mains or structural components, get attention first. Regularly update condition data for high-risk systems – annually at a minimum – and use real-time alerts to catch problems early [11]. Not only does this approach help avoid expensive failures, but it also sharpens your overall investment strategy, ensuring every dollar goes where it matters most.
Conclusion: Next Steps for Implementation
With your 90-day plan in place, the next challenge is turning it into action. This is where the real effort begins – moving from planning to execution and treating asset management as an ongoing cycle rather than a one-off task. Assets will age, patterns of use will shift, and new risks will arise over time[11]. Your plan needs to evolve alongside these changes. This phase builds on earlier steps like assessments, data groundwork, and scenario modeling, pushing your strategy from theory into practice.
Secure governance for long-term success. Start by locking in executive sponsorship and establishing cross-functional ownership. These actions will help ensure your asset management program weathers budget cycles and leadership transitions[1].
Volgende, create a consistent review process. Update asset condition data annually or biannually, and review portfolio dashboards quarterly to spot risks early[11]. Take actionable steps, such as scheduling condition updates during routine maintenance for critical assets and adjusting investment priorities based on real-time data[5].
Expand your efforts thoughtfully. Use early successes from a pilot department – like Fleet or Facilities – to showcase results and secure funding for broader implementation[1]. Reaching Level 2 maturity, where decisions are based on asset conditions rather than reacting to failures, typically takes 12–18 months of steady work beyond your initial 90-day effort[1]. It’s essential to stay disciplined during this phase; municipalities following this approach report average annual savings of $2.1 million[1].
Lastly, refine your models regularly. Monitor prediction accuracy, update risk scoring based on failures, and incorporate new condition data as it becomes available[3]. The most successful municipalities prioritize investing in skilled people and efficient processes, using technology as a tool to enhance these efforts[1]. Your 90-day plan lays the groundwork, but how you build on it determines whether you’re simply managing assets or unlocking their full potential.
FAQs
What’s the minimum asset data I need to start?
To get started, gather a detailed inventory of your assets. Include key details like their current condition, age, type, and any defect status. This data will allow you to create a condition index, helping you prioritize which assets need maintenance or replacement first.
How do I score asset risk in a simple way?
To assess asset risk effectively, focus on two main elements: kans op mislukking en gevolgen van falen. By multiplying these factors, you can determine a straightforward risk score. Incorporate data such as condition monitoring results, past failure records, and specific asset characteristics to fine-tune these scores. This method ensures attention is directed toward the most critical assets – those with a high chance of failure and potentially severe outcomes, like safety risks or operational interruptions.
What should an audit-ready Investment Policy Statement include?
An Investment Policy Statement (IPS) that’s ready for audit should leave no room for ambiguity. It needs to clearly define the portfolio’s objectives, ensuring investment goals align with the organization’s broader strategy and its risk tolerance.
The IPS should also address specific constraints, such as liquidity requirements, the time horizon for investments, and any legal or regulatory considerations. Beyond that, it must include an asset allocation framework, establish clear risk management guidelines, and specify performance evaluation criteria to measure success effectively.
Lastly, the document should detail governance processes, including roles, responsibilities, and review procedures. This ensures transparency and helps maintain compliance with applicable standards.
Verwante Blog Berichten
- Beheer van infrastructuuractiva: Een op risico gebaseerde aanpak voor meerjarenplanning van CAPEX
- Asset Investment Planning 101: Hoe te bepalen waarin te investeren, wanneer en hoeveel
- Hoe berekent u de werkelijke ROI van voorspellend onderhoud (en verwerkt u deze in uw investeringsplan)?
- 10 rode vlaggen die aangeven dat uw portefeuille met verouderende activa onderbelegd is