


When it comes to securing funding for aging infrastructure, the key is presenting a data-driven, risk-based business case. Here’s how you can make your proposal stand out and get approved:
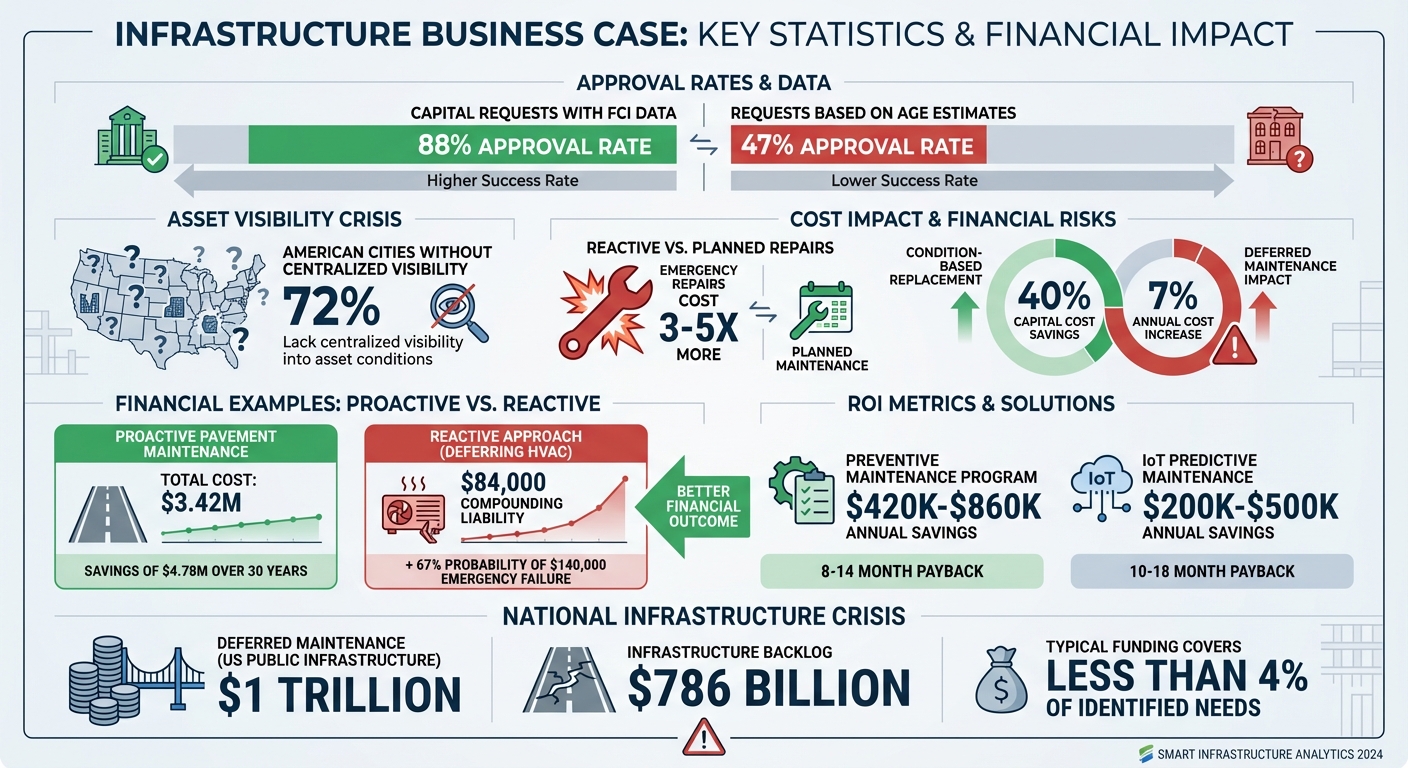
- Start with Asset Assessments: Document the condition of assets using a standardized system. Cities with condition-based data see approval rates of 88%, compared to 47% for those relying on age estimates.
- Quantify Financial Risks: Show the cost of inaction, including how deferred maintenance leads to higher expenses (up to 5x more for emergency repairs) and legal risks.
- Create a Multi-Year Plan: Spread costs over time, prioritize high-risk assets, and align with funding opportunities like federal grants.
- Show Business Value: Link investments to measurable outcomes like cost savings, risk reduction, and improved service quality.
- Present Clearly: Use visuals like heat maps and cost-of-deferral tables to make data easy to understand for decision-makers.
Infrastructure Business Case Approval Statistics and Cost Comparison
Quality of Major Transport Infrastructure Project Business Cases
sbb-itb-5be7949
Step 1: Assess Your Asset Conditions
Before making a strong case for investment, you need a clear understanding of the current state of your assets. Alarmingly, 72% of American cities lack centralized visibility into asset conditions or estimates of remaining useful life[5]. Without this consolidated data, justifying large-scale investments becomes an uphill battle.
Build a Complete Asset Inventory
Start by creating a detailed and accurate registry of your assets. This means documenting critical details like GIS location, installation date, materials, capacity, manufacturer, replacement value, and condition score – especially for high-priority assets like water and sewer mains, bridges, and key facility systems[1]. Your inventory should include:
- Unique ID and category for each asset
- Location and installation date
- Material and size or capacity
- Manufacturer and replacement value
- Current condition score
To maintain consistency, use a standardized 1–5 condition rating scale across all departments. For instance, a score of 5 reflects excellent condition (80–100% of useful life remaining), while a score of 1 indicates critical failure (less than 10% useful life remaining)[1]. Research shows that condition-based replacement strategies can save up to 40% in capital costs compared to age-based methods[1]. Tools like mobile inspection apps, which capture GPS-tagged photos and checklist data, can help field teams collect consistent, high-quality information[1][5].
Identify Risks and Potential Failures
With your inventory in place, the next step is to assess risks. Calculate each asset’s Risk Score by multiplying its probability of failure (based on condition) by its consequence of failure (criticality). Use tools like the Facility Condition Index to create visual heat maps, where green indicates low risk (<0.10), amber signals moderate risk (0.10–0.30), and red highlights high risk (>0.30)[1][2].
When presenting to decision-makers, consider including a "Cost of Deferral" table. This table illustrates how replacement costs could escalate over 3, 5, and 10 years, assuming an annual inflation rate of about 7%[2].
"The moment condition assessment data transformed our operations… was when we used that data to defend a CIP reallocation to the city council… The condition data didn’t just save money – it prevented a public health emergency."
– Director of Engineering, City of 120,000 residents[1]
Conduct On-Site Inspections and Gather Stakeholder Input
After calculating risk scores, verify your findings through on-site inspections and input from stakeholders. Tailor your inspection techniques to the specific asset type. For example:
- CCTV inspections for water and sewer lines, costing $3–$8 per linear foot[1].
- Automated pavement condition surveys, priced at $8–$15 per lane-mile[1].
- Bridge inspections, typically costing $2,000–$8,000 per structure[1].
- Facility condition assessments, ranging from $0.10 to $0.25 per square foot[1].
Finally, collaborate with key personnel – budget directors, financial administrators, and operations staff – to ensure your assessments are both thorough and practical. This comprehensive approach ensures that your data is not only accurate but also actionable.
Step 2: Quantify Risks and Financial Impacts
Now that you’ve built a detailed asset inventory and conducted a risk assessment, it’s time to translate that data into financial terms. Decision-makers need more than technical reports – they need to see the direct financial implications. This means calculating lifecycle costs, showing the cost of inaction, and proving how timely investments can save significantly more down the line. Breaking these down into clear and measurable financial metrics is key.
Calculate Lifecycle Costs and Financial Risks
Start by calculating the Nettogegenwartswert (NPV) over a 20- to 50-year period. This involves discounting all lifecycle costs – including capital expenses, operations and maintenance (O&M), and risk-adjusted failure costs – using a discount rate of 3–5% [7]. This method helps compare the costs of rehabilitating an asset versus fully replacing it.
Next, determine risk-adjusted failure costs by multiplying the Probability of Failure (PoF) (based on condition data) by the Consequence of Failure (CoF), which accounts for financial, operational, and reputational impacts. For instance, if an HVAC system has a 67% chance of failure and would cost $140,000 to replace in an emergency, the risk-adjusted cost comes out to $93,800.
"The difference between intervening at condition rating 3 (planned rehabilitation) and waiting until condition rating 1 (emergency replacement) is typically a 3-5x cost multiplier." – Taylor, Oxmaint [1]
Also, highlight how delaying investments compounds costs over time. Annual costs can increase by roughly 7%, driving up replacement expenses and the likelihood of catastrophic failures [2]. A simple table showing how costs escalate over 3, 5, and 10 years can make this point crystal clear.
Include Regulatory and Compliance Costs
In addition to lifecycle costs, factor in regulatory and compliance-related expenses. These can significantly alter the financial equation. Create a Compliance Deficiency Register to document issues like ADA accessibility gaps, OSHA violations, or fire code deficiencies, along with their associated penalties and legal risks [2]. This is especially compelling since executives and public officials could face personal liability for ignoring documented hazards.
Capital requests supported by Anlagenzustandsindex (FCI) data are far more likely to be approved – 88% compared to just 47% for requests based purely on estimates [2]. For example, Sam from Oxmaint provided a clear case:
"The HVAC is at FCI 0.38 – deferring replacement another year adds $84K in compounding liability and a 67% probability of emergency failure costing $140K+." – Sam, Oxmaint [2]
Factor in Energy Performance and Available Incentives
You can also shift the conversation from costs to potential revenue by identifying federal grants or incentives tied to your investments. Programs like the Zweiparteien-Infrastrukturgesetz (BIL) and EPA State Revolving Funds (SRF) can turn a modest expense into a significant funding opportunity. For instance, a $34,000 maintenance investment could unlock up to $2.1 million in grants [2].
Don’t forget to include energy-related returns on investment (ROI). A well-structured preventive maintenance program across 25 buildings could save $420,000–$860,000 annually through avoided emergencies and energy savings, with payback periods of 8–14 months. Similarly, integrating IoT sensors for predictive maintenance and energy optimization could yield $200,000–$500,000 in yearly savings, with payback periods ranging from 10–18 months [2]. When presenting to stakeholders, frame these investments as opportunities to multiply grant funding – this shifts the narrative from merely seeking a budget to unlocking financial growth [2].
Step 3: Create a Multi-Year Investment Plan
Once you’ve identified and quantified risks, the next step is to craft a phased investment plan that spreads costs over time while delivering measurable outcomes. A multi-year roadmap demonstrates to decision-makers how each dollar spent reduces risk, enhances service quality, and supports long-term goals like sustainability. This approach makes a large capital request feel more strategic and easier for stakeholders to approve. It also helps prioritize high-value projects that address the most critical risks.
Prioritize Investments by Risk and Value
Projects should be ranked based on both the likelihood and the consequences of failure [8]. Instead of relying solely on age-based replacement schedules, evaluate each asset’s condition, its operational importance, and the potential impact of failure – whether that’s related to safety, service disruption, or environmental harm.
A multi-criteria scoring matrix can make this prioritization process transparent and defensible. Common factors include:
- Asset condition, often measured by the Facility Condition Index (FCI)
- Safety risks
- Regulatorische Anforderungen
- Economic impact [9]
Data-driven capital planning has been shown to deliver far better returns compared to ad hoc or politically influenced planning. For instance, a proactive approach – like a $120,000 seal coat in Year 1 – resulted in a 30-year total cost of $3.42 million per mile. In contrast, a reactive strategy drove total costs up to $8.20 million per mile, saving $4.78 million through preventive action [9].
Develop a Phased Modernization Roadmap
Break your investment plan into 12- to 18-month phases, and recalibrate quarterly based on real-world asset performance, unexpected failures, and budget changes [8]. This "planning funnel" bridges long-term goals with short-term tactical actions, allowing for flexibility without losing sight of the overall mission.
Start by addressing high-risk assets – like those with an FCI above 0.30 – or projects that can deliver immediate cost savings, such as energy-efficient upgrades or avoiding emergency repairs [2].
Running "what-if" scenarios can also be incredibly useful. For example, a utility planning case showed that increasing the budget by just 10% for targeted refurbishments reduced total ownership costs by 22%. On the flip side, cutting the budget by 10% led to $4.3 million in additional costs over five years due to increased emergency maintenance [8]. By incorporating sustainability metrics into your roadmap, you can ensure that modernization aligns with broader environmental objectives.
Align with Sustainability and Carbon Reduction Targets
Investment plans today need to go beyond just fixing what’s broken – they should also support carbon reduction and ESG (Environmental, Social, and Governance) goals. Consider environmental costs like carbon emissions, energy waste, and pollution alongside financial and safety risks [8].
When planning upgrades, think about how you can meet current sustainability standards instead of simply replacing assets with equivalent models. For instance, replacing an outdated boiler with a high-efficiency heat pump not only mitigates the risk of failure but also contributes to carbon reduction goals. It could even open up opportunities for federal incentives or green funding programs.
"Bei der Investitionsplanung geht es darum, über einen mittel- bis langfristigen Horizont hinweg zu entscheiden, wie Kapital und Ressourcen so eingesetzt werden, dass die gesamten Lebenszykluskosten und Risiken minimiert werden." - Philippe Jetté, Produktmanager, Anlageninvestitionsplanung, IBM [8]
Step 4: Connect Infrastructure Investments to Business Goals
After conducting detailed asset assessments and quantifying risks, the next step is to clearly demonstrate how these investments translate into business value. While technical teams may understand the urgency, decision-makers often need to see a direct connection between infrastructure spending and organizational objectives. A business case that focuses only on asset condition or compliance risks may lose out to projects that promise revenue growth or operational benefits. The challenge lies in reframing infrastructure needs to highlight business advantages – like cost savings, risk reduction, enhanced service delivery, or progress in meeting environmental goals. This step builds on earlier risk assessments by linking technical data to strategic outcomes.
Frame Projects in Terms of Business Value
Structure your argument by prioritizing benefits: start with direct financial returns, then move to broader economic and social impacts [10]. Highlight measurable financial gains, such as reduced lifecycle costs, lower emergency repair expenses, and decreased energy bills. For instance, the Strategic Regional Research Alliance (SRRA) examined Sheridan College‘s campus location in 2009 and found that a downtown Mississauga site would generate more than twice the value of a free greenfield site. This was due to factors like increased student attraction and savings on parking infrastructure through better transit access. The Hazel McCallion Campus, which opened in 2011 and expanded in 2017, validated these projections [10].
To strengthen your case, show stakeholders the tangible consequences of budget cuts – whether 10%, 20%, or 30%. For example, illustrate how reduced funding could lead to increased traffic disruptions, compromised safety, or higher long-term costs [4]. This shifts the conversation from "Can we afford this?" to "Can we afford not to?" In the United States, publicly owned infrastructure faces an estimated $1 trillion in deferred maintenance, yet funding typically covers less than 4% of identified needs [6]. By making the financial impact of delays concrete and measurable, you can present a stronger argument for investment.
"Infrastructure investments shape communities for generations. The purpose of preparing a Business Case Analysis (BCA) is to provide decision makers with the best possible information to make the best possible decisions." – Strategic Regional Research Alliance [10]
Support Sustainability and ESG Commitments
Once financial benefits are clear, align these investments with broader sustainability and social goals. Infrastructure spending should not only maintain services but also contribute to environmental, social, and governance (ESG) objectives. Highlight how your projects support carbon reduction targets, improve energy efficiency, or comply with new environmental regulations. When evaluating options, factor in environmental costs – such as carbon emissions, energy waste, and pollution – alongside financial and safety risks [4].
For example, in 2013, SRRA developed a business case for the Downsview Aerospace Cluster in Toronto. They compared the economic benefits of retaining industrial employment with the potential gains from residential development. The analysis revealed that an aerospace research cluster would deliver greater productivity and economic value, exceeding a 1:1 cost-benefit ratio. This led to the creation of Centennial College‘s training and research facilities at the site and halted plans to sell surrounding land for residential use [10]. The business case demonstrated how infrastructure investments could align with broader goals like economic development and workforce training.
To drive the point home, present specific outcomes under different funding levels. Show how reduced funding could harm environmental and safety performance, and emphasize how strategic upgrades can lower vehicle operating costs, minimize traffic disruptions, and reduce carbon footprints [4]. By focusing on both financial and environmental priorities, you position infrastructure modernization as a strategic necessity rather than just an expense.
Step 5: Present the Business Case to Stakeholders
This is the moment to make your case clear and compelling so decision-makers can understand it instantly. By leveraging your detailed risk analysis and investment strategy, you can turn complex data into insights that resonate with stakeholders. How you present the information often determines whether your proposal gets approved or rejected. For example, capital requests supported by Facility Condition Index (FCI) data have an 88% approval rate, compared to just 47% for those based on estimates [2]. The goal is to translate technical evaluations into financial and risk-related terms that connect with executives, finance directors, and elected officials.
Organize the Business Case for Maximum Impact
Your presentation should follow a structured format with seven key elements in this order: Portfolio Condition Summary (using an FCI heat map), Cost of Deferral, Emergency Repair History (last 24 months), Legal/Compliance Exposure, Federal Grant Eligibility, Proposed Investment/Outcomes, und Accountability Metrics [2]. This approach moves the focus from immediate risks to long-term benefits. Start with an FCI heat map to provide a quick snapshot of portfolio health – this visual tool helps stakeholders grasp the situation in seconds without needing to read lengthy details [2].
Tailor your language to your audience. For instance:
- City council members prioritize issues like constituent safety, legal risks, and responsible financial management.
- Finance directors are more focused on ROI, payback periods, and distinguishing between capital and operating expenses.
- Risk managers want to see documented risks of negligence and clear audit trails [2].
Instead of saying, "The HVAC system is outdated", reframe it as: "City Hall HVAC is at FCI 0.41. Deferral adds $84,000 in compounding liability and a 67% chance of emergency failure next year" [2]. This shifts the conversation from technical details to financial and operational consequences.
"City council members approve maintenance budgets based on one factor: confidence that the spend is defensible and the risk of not spending is greater than the cost." – Sam, Oxmaint [2]
Use Visual Tools to Highlight Key Metrics
Visual aids make complex data easier to digest. For example:
- FCI heat maps quickly convey portfolio health in a way that elected officials can interpret faster than spreadsheets [2].
- Deterioration curves show how asset decline accelerates, illustrating the critical point where repair costs jump from 1x to 3–5x [1].
- A cost-of-deferral table can clearly demonstrate how delaying maintenance leads to higher expenses [2].
For instance, show how underfunding by 10%, 20%, or 30% increases traffic disruptions, reduces safety, and drives up long-term costs [4]. Use a comparison chart to highlight the difference between the current 42% reactive repair ratio, which costs $620,000 annually in emergency premiums, and a $340,000 planned maintenance program that could prevent these costs [2]. A simple table showing how intervention costs escalate by condition rating – from 0.3x at Excellent to 3–5x at Critical – can make a powerful financial argument for taking action now [1].
Prepare Audit-Ready Documentation
Once you’ve presented the data visually, back it up with audit-ready documentation. Ensure every number can be verified. Include timestamped, geotagged reports and a quarterly dashboard that tracks PM compliance and reactive repair ratios [2][12]. Highlight documented compliance deficiencies – such as ADA, OSHA, or fire code violations – with specific statutory references. Decision-makers are more likely to approve budgets when deferral exposes them to personal legal risks for negligence [2].
Add a sensitivity analysis to show a "worst-case scenario" where only 50% of projected savings are realized. If the project still breaks even within 24 months, it strengthens your case even further [11]. Finally, position maintenance spending as a pathway to secure federal funding – like BIL or EPA SRF grants – where small investments unlock eligibility for millions in grants [2]. This reframes maintenance as a strategic move, transforming it from a cost burden into a financial opportunity.
Key Considerations for Aging Infrastructure Projects
After your business case gets the green light, it’s time to dive into modernization. But keeping things running smoothly while upgrading requires careful planning and precise execution. Two big hurdles will stand in your way: maintaining uninterrupted service during upgrades and navigating supply chain challenges that could throw off your timeline and budget. Tackling these issues early helps safeguard your project from costly disruptions and keeps stakeholders confident in your ability to deliver.
Maintain Operations During Modernization
When modernizing, don’t simply upgrade assets based on their age. Instead, focus on the potential impact of failures. For each critical asset, create a "cascade map" to understand the sequence of failures – what breaks first, what follows, and the financial impact over 4-hour, 24-hour, and 72-hour periods [13]. This approach ensures you’re not just replacing old equipment but actively protecting operations.
Take power systems as an example. Start by deploying Uninterruptible Power Systems (UPS) to handle brief grid losses. Then, add standby generators for longer outages and, eventually, microgrids to manage extended instability [13]. This layered strategy minimizes the risk of the dreaded "switchover gap", where critical systems lose power during transitions. It’s worth noting that roughly 40% of European Union grids are over 40 years old and were designed for outdated load profiles. Modernization efforts must align with today’s demand, not yesterday’s assumptions [13].
Another key step is preserving operational knowledge before experienced staff retire or leave. Structured workshops can help document system operations and update safety protocols [3]. Also, treat digital infrastructure as an integral part of your physical assets from the start. Sensors, analytics, and control systems should be integrated early to avoid compatibility issues during outages [13].
While ensuring seamless operations is essential, managing supply chain risks is just as critical for staying on track.
Manage Supply Chain and Resource Constraints
External risks, like supply chain disruptions and labor shortages, can derail even the best-laid plans. To prepare for these challenges, use sensitivity analyses to test for potential cost overruns of ±10% to ±30% [7]. Additionally, establish a liquidity buffer to cover three months of operating expenses or the 10th percentile of potential cash shortfalls [13]. This financial cushion can keep your project moving if material costs spike or delivery schedules slip.
Address workforce shortages by investing in training programs. For instance, a training initiative in Western Australia equipped over 16,000 workers with the skills needed for modernization projects, achieving a 90% satisfaction rate [14]. Industry-funded training levies could provide a sustainable way to build the talent pipeline required for long-term efforts.
Streamlining permitting processes is another way to avoid delays. The Danish Energy Agency, for example, implemented a "single-window" system for wind farm permits, reducing application processing time to just over 10 days. This approach enabled offshore wind projects to be completed in 34 months, compared to up to eight years elsewhere in the EU [14]. Additionally, techniques like cured-in-place pipe (CIPP) can restore infrastructure integrity with minimal disruption [7]. Don’t forget to include specialized vehicles in your asset plans to ensure you’re fully prepared [12].
Schlussfolgerung
Getting approval for your aging infrastructure business case hinges on solid evidence, not rough estimates. Submissions backed by documented data, like Facility Condition Index (FCI) scores, have an 88% approval rate, compared to just 47% for those relying on age-based assumptions [2]. Decision-makers prioritize financial risk, legal obligations, and responsible fiscal management over operational wish lists. These factors should shape your risk-based investment strategy.
Instead of simply requesting new equipment, focus on quantifying the risks of inaction. For example, deferring maintenance can add $84,000 in compounded liability and carries a 67% chance of a $140,000 emergency failure [2]. Highlight how deferrals compound costs at a 7% annual rate and emphasize that emergency repairs are 3 to 5 times more expensive than planned maintenance [2]. This approach underscores the financial and legal risks of postponing action.
"Council members approve risk mitigation, not operational maintenance." – Sam, Oxmaint [2]
Use tools like color-coded FCI heat maps and clearly document compliance gaps, such as ADA, fire code, and safety violations, to demonstrate the legal and financial exposure created by deferral [2]. Position local investments as opportunities to unlock federal funding, showing how they can serve as leverage for programs like BIL or EPA SRF [2].
Additionally, establish a quarterly dashboard to track metrics like preventive maintenance, reactive repair ratios, and FCI changes. This not only builds trust but also provides measurable proof of progress. By grounding your case in clear, quantifiable risks, you’ll not only secure approvals but also help shield your organization from the $786 billion infrastructure backlog caused by deferred action [1]. With the right data and framing, your business case becomes a powerful tool for safeguarding your organization’s financial future.
FAQs
What’s the fastest way to build a reliable asset condition inventory?
The fastest way to build a dependable asset condition inventory is to establish a structured condition assessment program. Incorporate pipe-by-pipe inspection data, failure probability scores, und remaining useful life projections to maintain precision. Using tools like mobile inspections, GIS integration, and automated data collection can simplify the process. These methods help convert subjective observations into objective insights, enabling smarter prioritization and more informed decision-making.
How do I calculate risk scores and the cost of deferral for an asset?
To determine risk scores, start by evaluating the asset’s condition using inspection data, the likelihood of failure, and its remaining useful life (RUL). Using standardized rating systems can simplify the process, allowing you to quantify the asset’s health and assign appropriate risk levels.
When calculating the cost of deferral, consider how postponing maintenance impacts both the risk of failure and the associated repair costs. Delaying maintenance often results in significantly higher risks and expenses over time, so conducting thorough technical risk assessments is crucial for making accurate projections.
Which charts and metrics work best to win stakeholder approval?
When it comes to securing stakeholder buy-in, the right visuals can make all the difference. The most effective charts and metrics clearly present evidence-based data on asset conditions and associated risks. Examples that resonate include:
- Condition maps: These provide a visual overview of asset health, making it easy to identify areas requiring attention.
- Failure probability scores: Highlighting the likelihood of asset failure helps stakeholders understand potential risks.
- Remaining useful life projections: Offering insights into how much longer an asset can function effectively supports planning and decision-making.
- Cost-of-deferral estimates: Showing the financial impact of delaying maintenance underscores the importance of timely investments.
These visuals not only illustrate the current state of assets but also highlight the financial implications of inaction. Adding data like emergency repair histories can further reinforce the urgency for proactive measures, helping build trust in the data and justifying the need for investment.
Verwandte Blogbeiträge
- Verwaltung von Infrastrukturanlagen: Ein risikobasierter Ansatz für die mehrjährige CAPEX-Planung
- Strategische CAPEX-Planung für Autobahnkonzessionen: Abwägung zwischen der Einhaltung der Vorschriften des Konzessionsgebers und der Rentabilität am Ende der Vertragslaufzeit
- Anpassung an den Klimawandel für alternde Vermögenswerte: Wo man zuerst investieren sollte
- 90 Tage bis zu Ihrem ersten Vermögensanlageplan: Ein Leitfaden für die schrittweise Umsetzung