


Managing underperforming buildings is a major challenge for property portfolios, but a data-driven approach can save costs and improve performance. Here’s the bottom line:
- Older buildings dominate the U.S. market: 62% are over 30 years old, often with outdated systems and deferred maintenance.
- Deferred maintenance costs are skyrocketing: Emergency repairs cost 4.8× more than planned maintenance, with U.S. backlogs exceeding $1 trillion.
- Key metrics to track: Energy Use Intensity (EUI), maintenance cost per square foot, and Facility Condition Index (FCI).
- Proactive planning saves money: Predictive tools reduce emergency costs by 64%, extend asset lifespans by 15–25%, and cut budget variances to under 15%.
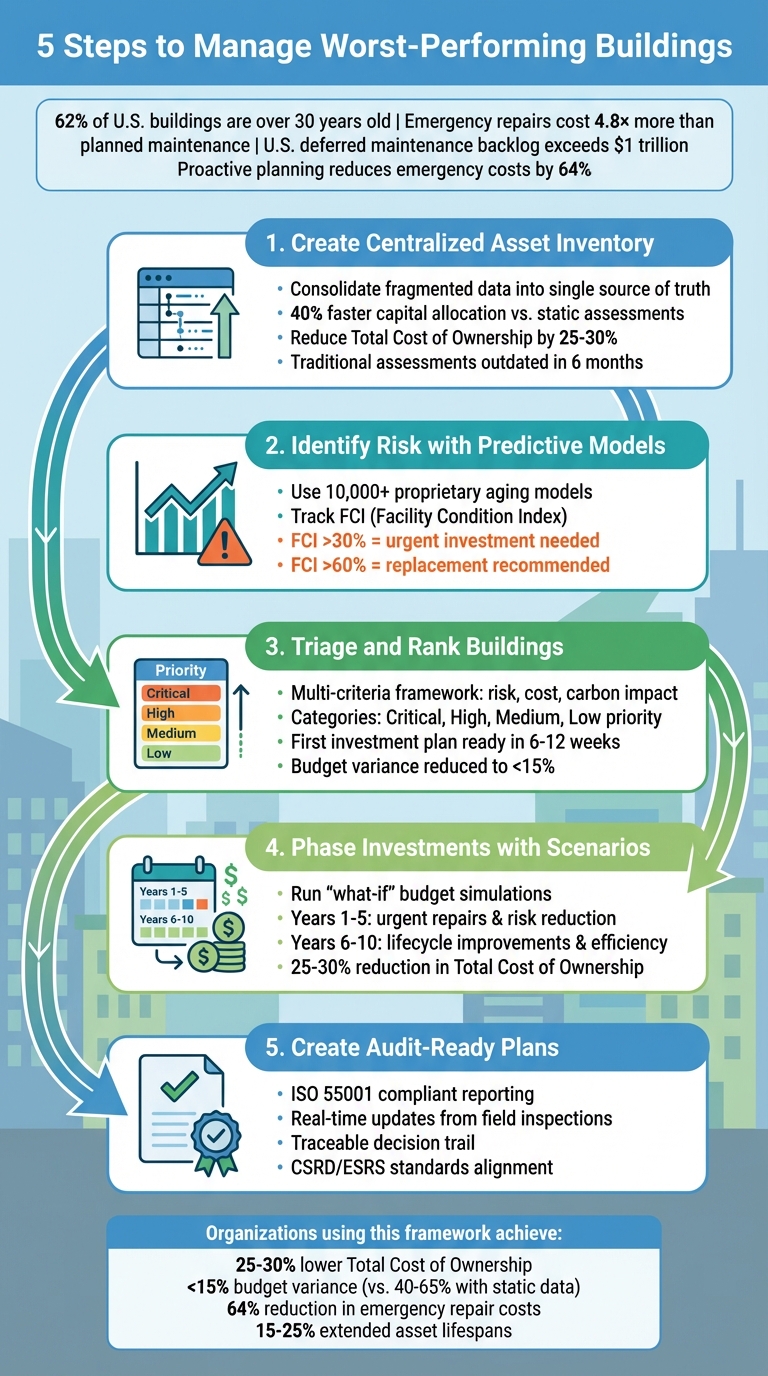
5-Step Framework for Managing Worst-Performing Buildings in Property Portfolios
Step 1: Create a Centralized Asset Inventory
Before you can identify which buildings are draining your budget, you need a complete and centralized asset inventory. This inventory serves as the backbone for any risk-based assessment, ensuring that decisions are well-informed and investments are targeted. Relying on manual processes or isolated data often leads to poor decision-making. Many organizations still depend on outdated models and one-off analyses, making it difficult to justify budgets, demonstrate impact, or achieve sustainability goals [2].
A well-structured inventory organizes your data into a clear hierarchy – covering sites, buildings, systems, and individual components. It standardizes attributes across the entire portfolio, such as technical details, financial information, and energy performance metrics. This structure enables easy site-by-site comparisons of budget trends and performance, helping you identify outliers more effectively [2]. Organizations that adopt dynamic tracking tools report a 40% faster capital allocation process compared to those using static assessments [1]. Plus, using accurate data to optimize intervention timing can reduce Total Cost of Ownership (TCO) by 25% to 30% [2].
"We needed a tool that would allow us to consolidate the fragmented data we had and project it in a way that could be clearly presented to our elected officials, who are the decision-makers." – Chief Executive Officer, Meuse Department [2]
The shift from static snapshots to a dynamic, living system is critical. Traditional facility assessments quickly become outdated – often within six months – leading to budget discrepancies of 40–65% [1]. A centralized inventory that updates in real time as work orders are completed ensures your data stays relevant and your decisions stay grounded.
How to Structure Your Asset Register with Simeo Inventory
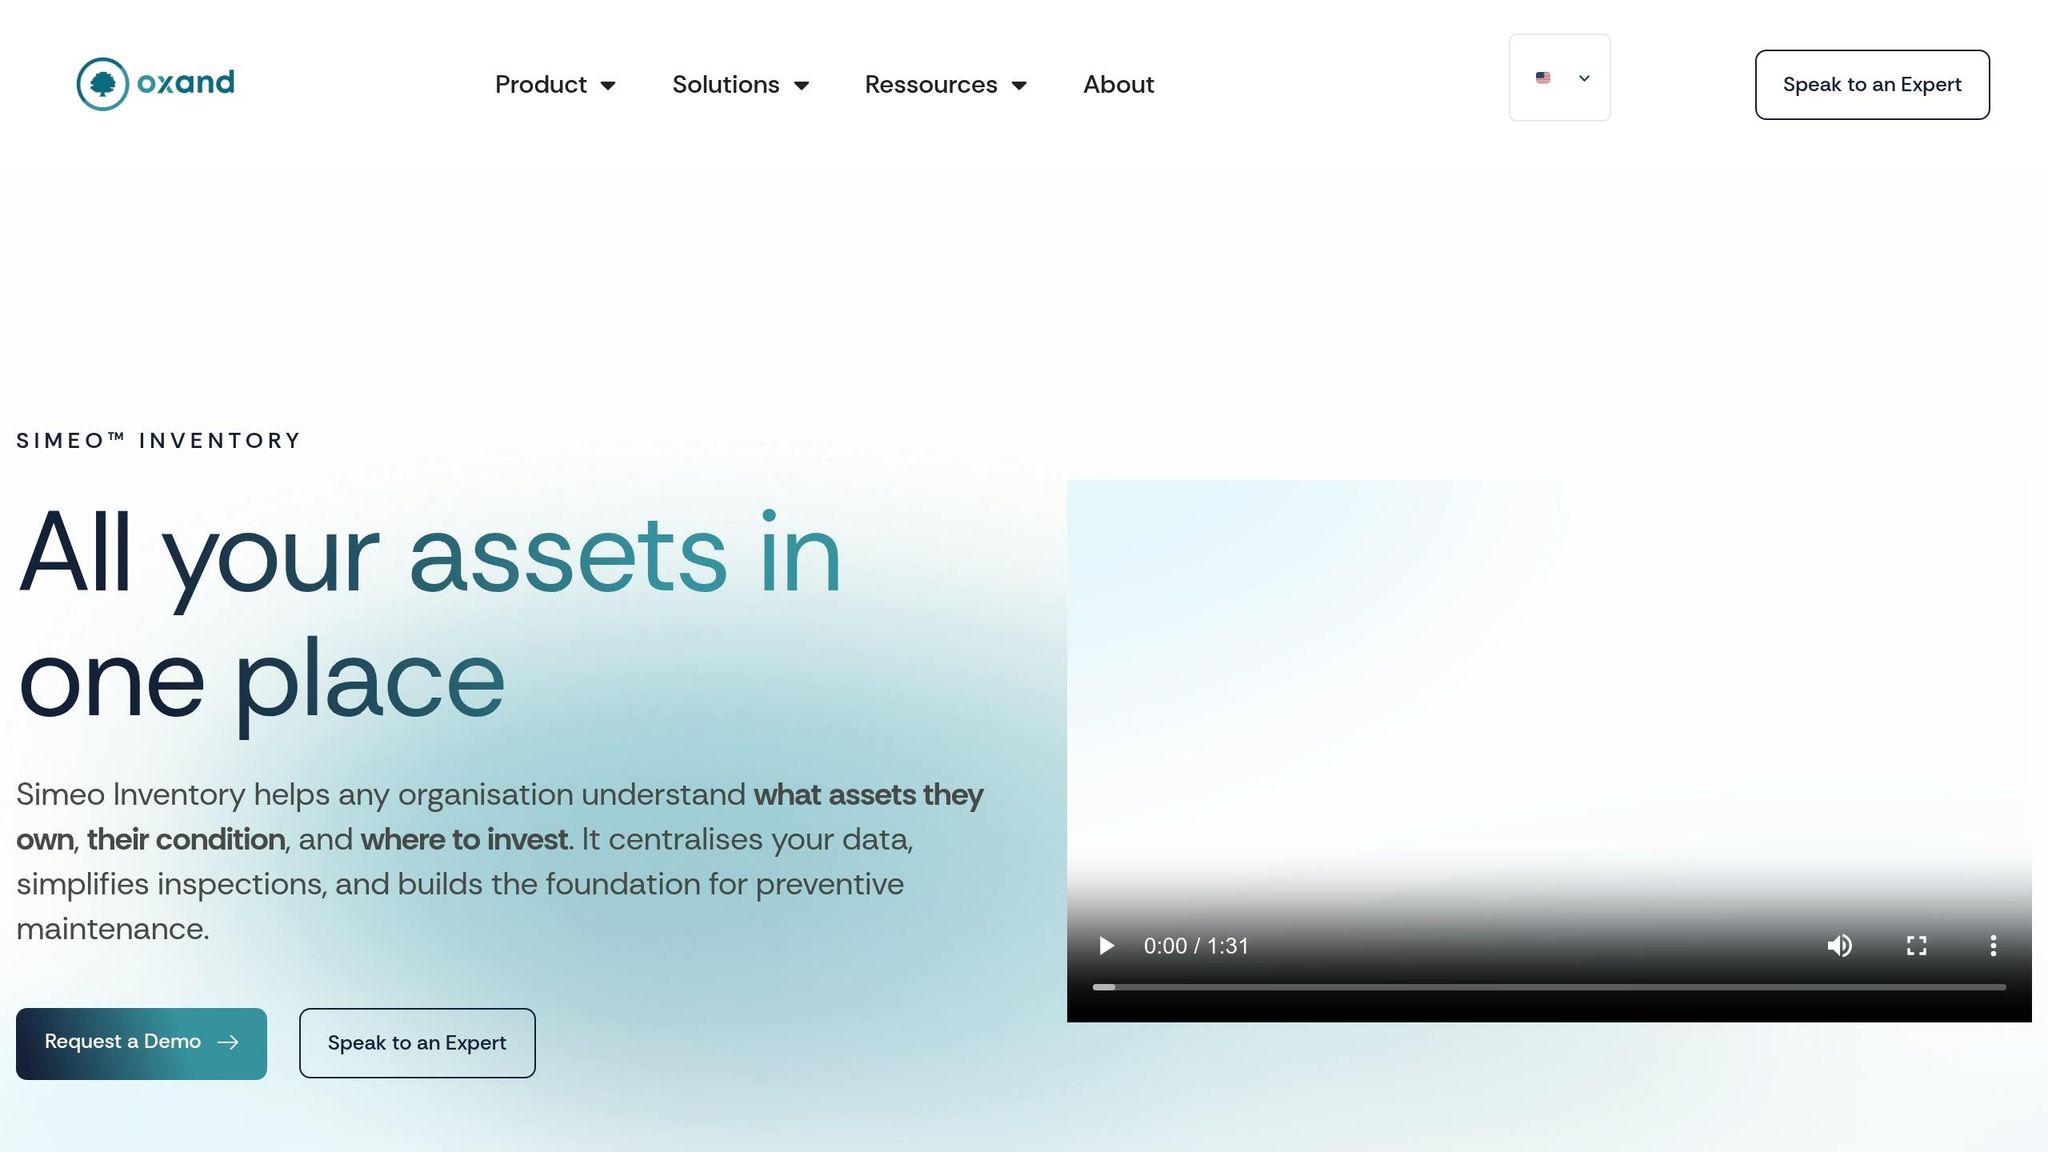
To create this centralized inventory, consider using Oxand Simeo™ Inventory. This platform acts as the single source of truth for your entire portfolio. It standardizes asset hierarchies, records condition data, and builds a reliable database for analysis. With pre-built templates and import tools, Simeo Inventory makes onboarding faster and ensures consistency across various sites [2].
Begin by breaking down siloed systems and consolidating all related data into one platform to close any credibility gaps [2]. The system enforces strong data governance through ownership records, completeness checks, and audit trails [2].
What sets this tool apart is its ability to connect raw asset data with predictive models for aging and degradation. These models help forecast failures and prioritize assets where breakdowns could lead to significant financial, safety, or service disruptions [2]. With this approach, you’re not just keeping track of what you own – you’re anticipating what might fail and when.
Collect Accurate Data with Digital Inspections
Paper-based assessments are slow, prone to errors, and often outdated by the time they’re reviewed. Enter Simeo GO, a mobile inspection tool that simplifies the process. During site visits, field teams can record condition scores, take photos, and add notes directly in the app. This information is instantly synced with the centralized system [2][1].
This method eliminates errors from manual data entry and removes delays caused by post-assessment processing. It also ensures your inventory reflects the current state of your assets rather than outdated snapshots [1]. Digital inspections link condition scores and deficiency costs directly to asset records, allowing you to automatically calculate metrics like the Facility Condition Index (FCI) [1].
"We turned to Oxand because we needed a tool that would provide us with a predictive – not just corrective – view and help us manage our investments more effectively." – Head of Budget and Asset Valuation Department, In’li [2]
With an accurate, up-to-date digital inventory in place, you’re ready to move forward into predictive modeling. This sets the stage for identifying risks and planning smarter investments in future phases.
sbb-itb-5be7949
Step 2: Identify Worst-Performing Buildings with Predictive Models
Once you’ve built a centralized asset inventory in Step 1, the next step is to use predictive models to pinpoint which buildings are at the highest risk. Relying solely on age or visual inspections doesn’t always tell the whole story. For example, a 20-year-old building with well-maintained systems might perform better than a 10-year-old building with neglected infrastructure. Predictive models replace guesswork with data-driven insights, helping you identify which buildings are on the path to failure – and when.
The goal here is to turn static data into actionable, forward-looking risk scores. This approach helps avoid costly emergency repairs by addressing issues before they escalate [1]. Predictive aging models, in particular, provide a clear picture of how and when systems will deteriorate.
Use Predictive Aging Models to Forecast Problems
Oxand’s platform is built on more than 10,000 proprietary aging and performance models developed over two decades of work on infrastructure projects. These predictive models take static metrics, like the Facility Condition Index (FCI), and turn them into dynamic scores that update in real time as work orders are completed. They forecast the degradation of critical systems – like HVAC, roofing, electrical, plumbing, and structural components – especially as they near or exceed their design life [1].
Take a chiller, for instance. As it approaches the end of its 20-year lifespan, it doesn’t just fail out of the blue. Predictive models can track its gradual decline in efficiency, rising energy consumption, and increasing probability of failure over time.
The FCI, calculated as Deferred Maintenance Cost divided by Current Replacement Value, becomes even more powerful when paired with these models. They can predict how the FCI will change if maintenance is delayed. For example, an FCI above 30% indicates urgent investment is needed, while an FCI exceeding 60% suggests replacement may be the better option [1].
"The Facility Condition Index is the single most powerful number in facilities management – yet most FM teams still calculate it once every 3–5 years from a static spreadsheet." – Gon Daren, Oxmaint [1]
Here’s a real-world example: In February 2026, a 36-building commercial portfolio in Atlanta used an AI Asset Health Index to monitor a 200-ton chiller. While traditional calendar-based maintenance showed no issues, the AI model detected a 23% increase in compressor draw and declining efficiency. Acting on this insight, the team scheduled a $6,200 bearing replacement, avoiding a $187,000 emergency failure. Even more importantly, they prevented tenant disruptions that could have cost $940,000 in annual lease revenue [3].
Rank Buildings by Combined Risk Scores
Once you’ve forecasted system deterioration, the next step is to prioritize investments by assigning combined risk scores. These scores integrate financial metrics, operational health, and the potential consequences of failure, ensuring capital is allocated where it’s needed most. This method goes beyond simply addressing the oldest buildings – it focuses on those whose failure would have the most serious impact.
For instance, a hospital’s HVAC system failure would have far more critical consequences than the same failure in a storage facility. By factoring in mission criticality alongside condition scores, you can set stricter thresholds for high-stakes buildings. Organizations using dynamic tracking often report budget variances of less than 15%, compared to the 40–65% range seen with static assessments [1].
Predictive models also account for the continuous growth of risk, updating scores to reflect increasing urgency. A building that ranks low-risk today might become a high-priority target next year if its condition deteriorates rapidly. This ensures your investment strategy stays flexible and evolves as conditions change.
Step 3: Triage and Rank Buildings for Investment
Once risks are identified through predictive modeling, the next step is to prioritize and rank assets for investment. It’s not enough to address assets in poor condition – what matters is the potential impact of those conditions. For instance, a broken elevator in a hospital poses a much greater risk than the same issue in a warehouse. The goal of triage is to allocate funds where they can prevent serious consequences, reduce risks, and yield the best returns.
It’s important to avoid relying on single-metric rankings. An asset might perform poorly on one measure but not pose an immediate threat, while another asset with moderate scores could present serious safety or compliance risks. A broader evaluation – considering factors like risk exposure, lifecycle costs, compliance gaps, and carbon impact – creates a solid framework that balances urgent repairs with long-term objectives.
Apply a Multi-Criteria Ranking Framework
Oxand Simeo™ uses a multi-criteria framework to assess assets based on risk, cost, performance, and carbon impact [2]. This system ensures that decisions are grounded in measurable data rather than subjective opinions, applying the same evidence-based logic across the board.
Risk-based prioritization helps identify critical assets by analyzing the likelihood of failure, operational consequences, and exposure to financial or safety risks [2]. For example, an aging HVAC system in a school ranks higher than one in an administrative office due to its potential impact on student health, regulatory compliance, or even school closures. The framework also evaluates the financial and operational costs of delaying action, making it easier to justify budgets by clearly showing the trade-offs of inaction [2].
Another key feature is the integration of sustainability and ESG (Environmental, Social, and Governance) metrics. This approach ties investment decisions to measurable energy performance and decarbonization goals [2]. By embedding carbon reduction into the ranking process, organizations can track how investments align with regulatory compliance and net-zero targets. With optimized timing and prioritization, organizations can often reduce their Total Cost of Ownership (TCO) by 25% to 30% [2], largely by addressing problems early, before they escalate into emergencies.
"We turned to Oxand because we needed a tool that would provide us with a predictive – not just corrective – view and help us manage our investments more effectively. Oxand stood out for its risk management capabilities." – Head of Budget and Asset Valuation Department, In’li [2]
The system leverages over 10,000 predictive models to forecast asset degradation and more than 30,000 recommended actions to standardize investment decisions across portfolios [2]. This ensures consistent evaluation, whether the asset is a hospital in Boston or a school in Phoenix. Most organizations achieve their first data-driven investment plan within 6 to 12 weeks of implementation [2], a significant improvement over the lengthy manual processes of traditional methods.
Group Buildings into Triage Categories
Using the multi-criteria scores, buildings can be sorted into clear priority groups. These categories – Critical, High, Medium, and Low – help streamline budget allocation and scheduling by reflecting both the urgency of the issues and the consequences of inaction.
- Critical: These buildings face immediate risks, such as safety hazards, major service interruptions, or regulatory violations. Examples include hospitals with failing electrical systems, schools with structural issues, or social housing with non-compliant heating systems. Investments here should be addressed within the current fiscal year.
- High Priority: These assets face significant risks but are not yet at a critical failure point. For instance, a building with rising operational costs and emerging safety concerns might fall into this category. Delaying action could worsen the risks and lead to much higher costs.
- Medium and Low: These buildings are either stable or deteriorating slowly. While they can be scheduled for future budget cycles, they still require regular monitoring. Predictive models ensure that if conditions suddenly worsen, these buildings can be re-prioritized.
The criteria for triage can vary by sector. For example, social housing prioritizes comfort and safety, while healthcare focuses on operational continuity and minimizing failures [2]. The Meuse Department in France used Simeo to consolidate fragmented asset data and develop a long-term, data-backed master plan for budget approval by elected officials [2].
Step 4: Phase Investments Using Scenario Simulations
Once you’ve identified and prioritized your assets, the next step is to map out investments over several years. Since annual budgets rarely cover all necessary interventions, the aim is to phase investments in a way that reduces risks, manages costs, and aligns with sustainability goals. This phased approach ensures that resources are allocated where they can deliver the most impact over time.
Using scenario simulations, asset managers can explore different investment strategies before making financial commitments. These simulations combine risk assessments with budget and decarbonization objectives, offering a clearer view of how various funding scenarios impact asset performance, operational risks, and carbon emissions. This method shifts planning from reactive fixes to proactive, strategic decision-making, where every dollar spent is tied to measurable results.
Run Budget and Decarbonization Scenarios
Tools like Oxand Simeo™ enable asset managers to run "what-if" scenarios by adjusting factors such as budgets, timelines, and sustainability targets. For example, you can compare different annual CAPEX allocations to see how funding variations affect risk levels, service continuity, and carbon reduction goals over a multi-year period.
Organizations that fine-tune their intervention timing through scenario simulations often see a 25% to 30% reduction in their total cost of ownership [2].
A great example comes from the Meuse Department in France. Using scenario-based simulations, they transformed fragmented asset data into a cohesive master plan. By modeling various budget allocations, they forecasted investment needs in a way that elected officials could easily understand. This approach helped secure long-term funding for vital infrastructure upgrades, creating a phased investment plan that balanced immediate needs with future goals.
Build Multi-Year Investment Schedules
After running simulations, the next step is to design a phased investment schedule that spreads out projects over manageable timelines. A common strategy divides the plan into two phases: the first 1–5 years focus on urgent repairs and risk reduction, while years 6–10 target lifecycle improvements and energy efficiency upgrades [2].
For instance, a social housing organization might prioritize replacing failing boilers in high-priority buildings during the first phase. Roof replacements and insulation upgrades could then follow in later years as part of a larger decarbonization effort. Meanwhile, buildings with lower priority can be scheduled for future phases, with ongoing monitoring to ensure conditions don’t deteriorate unexpectedly.
This phased approach prevents budget strain in any single year and ensures critical issues are tackled first. It also helps organizations align their spending with external funding opportunities, regulatory deadlines, or grant cycles. In’li, a real estate company, used Oxand Simeo to transition from reactive to predictive planning. By integrating energy performance goals into their models, they managed investments more efficiently while meeting both risk and sustainability targets [2].
Most organizations can develop a robust, multi-year investment plan within 6–12 weeks [2]. The result? A well-structured and transparent schedule that not only fits within budget constraints but also satisfies boards, regulators, and other key stakeholders.
Step 5: Create Audit-Ready Plans and Track Results
Once you’ve phased your investments, it’s time to document your decisions and closely monitor the results. This step goes beyond fulfilling regulatory requirements – it’s about creating a clear, defensible record of your choices. With well-documented, traceable plans, you can justify budget requests to boards, satisfy auditors, and adapt your strategies as new information comes to light. This process lays the groundwork for detailed reporting and flexible updates.
Generate Traceable Reports
Oxand Simeo™ simplifies the process of creating reports that align with ISO 55001 standards, ensuring they’re ready for regulatory audits and stakeholder evaluations. These reports provide a comprehensive decision trail, covering everything from the buildings prioritized to the criteria used for selection, the level of risk reduction achieved, and the resulting carbon savings. By documenting every step, you establish a crucial link between risk assessments and the ongoing performance of assets. The system also includes role-based access controls and audit trails to log every change made.
"Our models help organisations align their investments with European regulations, ISO 55000, CSRD/ESRS standards and long-term decarbonisation goals, providing compliant, transparent and verifiable investment plans." – Oxand [2]
For example, LaGuardia Airport‘s Chief Technical Officer used this framework to conduct a Maturity Assessment of their Asset Management practices. This assessment served as a foundation for achieving ISO 55001 certification. By starting with a structured evaluation, they transitioned from ad-hoc processes to a systematic approach, creating audit-ready documentation capable of meeting stringent regulatory requirements.
Update Plans with New Data
Investment plans shouldn’t remain static. As inspections are completed, projects progress, or building performance shifts, your plans need to evolve. Oxand Simeo integrates seamlessly with digital inspection tools like Simeo GO, allowing condition data to flow directly from the field into the platform. Inspectors can update asset conditions in real time, and this information feeds into predictive models, refining forecasts and reprioritizing tasks as needed.
The platform uses AI and machine learning to detect patterns and improve its predictive capabilities with each new data point. If a building’s condition worsens faster than expected, the system flags it for earlier action. On the other hand, if an asset outperforms expectations, you can defer work and reallocate funds. This constant refinement ensures your plans remain aligned with actual conditions, avoiding reliance on outdated assumptions.
Conclusion: Main Steps for Managing Worst-Performing Buildings
Effectively managing your worst-performing buildings involves five key steps: centralizing asset data, using predictive models to identify at-risk buildings, prioritizing based on risk and criticality, phasing investments through scenario simulations, and creating audit-ready plans with real-time updates.
Tools like Oxand Simeo™ simplify this process by consolidating scattered data and leveraging over 10,000 predictive models. These capabilities allow organizations to shift from reactive repairs to proactive management. The result? Many organizations report a 25% to 30% reduction in Total Cost of Ownership [2].
Dynamic asset management also brings financial clarity. It reduces CapEx budget variance to under 15%, a significant improvement compared to the 40–65% variance seen with static data [1]. This level of precision not only strengthens proposals to boards and auditors but also ensures compliance with standards like ISO 55001 and CSRD/ESRS. Given the growing backlog of deferred maintenance, having data-driven, defensible plans is no longer optional – it’s essential.
This approach doesn’t just focus on finances. It also weaves sustainability into every decision. By integrating carbon reduction goals directly into budgeting and planning, you can align decarbonization targets with operational needs. This ensures that your portfolio meets sustainability benchmarks without sacrificing service levels or losing control of costs. Instead of treating carbon reduction as a separate project, it becomes part of the broader asset management strategy, adapting to changing conditions over time.
Shifting from manual, reactive processes to predictive, risk-based planning transforms how resources are allocated. It clarifies which buildings need urgent action and provides a clear view of how each decision will affect your budget, risk exposure, and carbon footprint for years to come.
FAQs
What’s the fastest way to spot the worst buildings in my portfolio?
The Facility Condition Index (FCI) is one of the fastest tools for spotting underperforming buildings. It works by comparing deferred maintenance costs to the replacement value, offering a clear snapshot for dynamic risk assessment. On top of that, AI-driven maintenance risk scoring can pinpoint assets that show early signs of wear and tear. This allows you to take proactive steps to address issues before they escalate into major failures. Keeping these metrics updated regularly ensures you can prioritize effectively and manage your portfolio with precision.
How do I set risk thresholds that tell me “repair” vs “replace”?
Setting risk thresholds for deciding whether to "repair" or "replace" equipment or facilities requires a careful look at several factors. These include the remaining useful life, maintenance costs, performance metrics, and potential failure risks. Tools like the Facility Condition Index (FCI) or energy performance scores can help pinpoint critical decision points.
It’s important to align these thresholds with your organization’s financial objectives and sustainability priorities. Regular updates based on lifecycle assessments and real-time performance data ensure your strategy stays relevant and effective.
How can I phase upgrades to cut costs and still hit decarbonization goals?
To manage upgrades while keeping costs low and working toward decarbonization goals, begin with a thorough evaluation of your building’s current condition. Coordinate these upgrades with your existing capital improvement plans to get the most return on investment and minimize interruptions. Use portfolio analysis tools to pinpoint phased retrofits that are both cost-effective and practical across your properties. By carefully timing your investments and relying on data-driven insights, you can reduce expenses and hit your sustainability targets effectively.