


Gerir grandes carteiras de activos como estradas, pontes e sistemas de água é um desafio devido aos orçamentos limitados e à necessidade de evitar falhas. Sem definição de prioridades, as equipas reagem frequentemente a emergências em vez de as prevenirem. A manutenção preditiva oferece uma solução, ajudando as organizações a concentrarem-se nos activos críticos e a reduzirem os custos. Eis como:
- Criar um inventário de activos centralizado: Criar um registo detalhado com a identidade dos bens, especificações técnicas, dados financeiros e classificações de estado.
- Avaliar a criticidade e o risco de falha: Classifique os activos com base na segurança, impacto na produção e probabilidade de falha.
- Quantificar o ROI: Utilizar métricas financeiras para justificar as decisões de manutenção, incluindo os custos do ciclo de vida e as poupanças de energia.
- Aplicar um quadro de pontuação: Utilizar uma abordagem estruturada para classificar os activos e afetar os recursos de forma eficaz.
- Cenários de teste: Simular cenários orçamentais e de risco para otimizar os planos.
- Implementar e aperfeiçoar: Comece com activos de grande impacto, monitorize os resultados e actualize os planos regularmente.
Esta abordagem reduz as reparações de emergência, prolonga a vida útil dos activos e alinha a manutenção com os objectivos financeiros e operacionais.
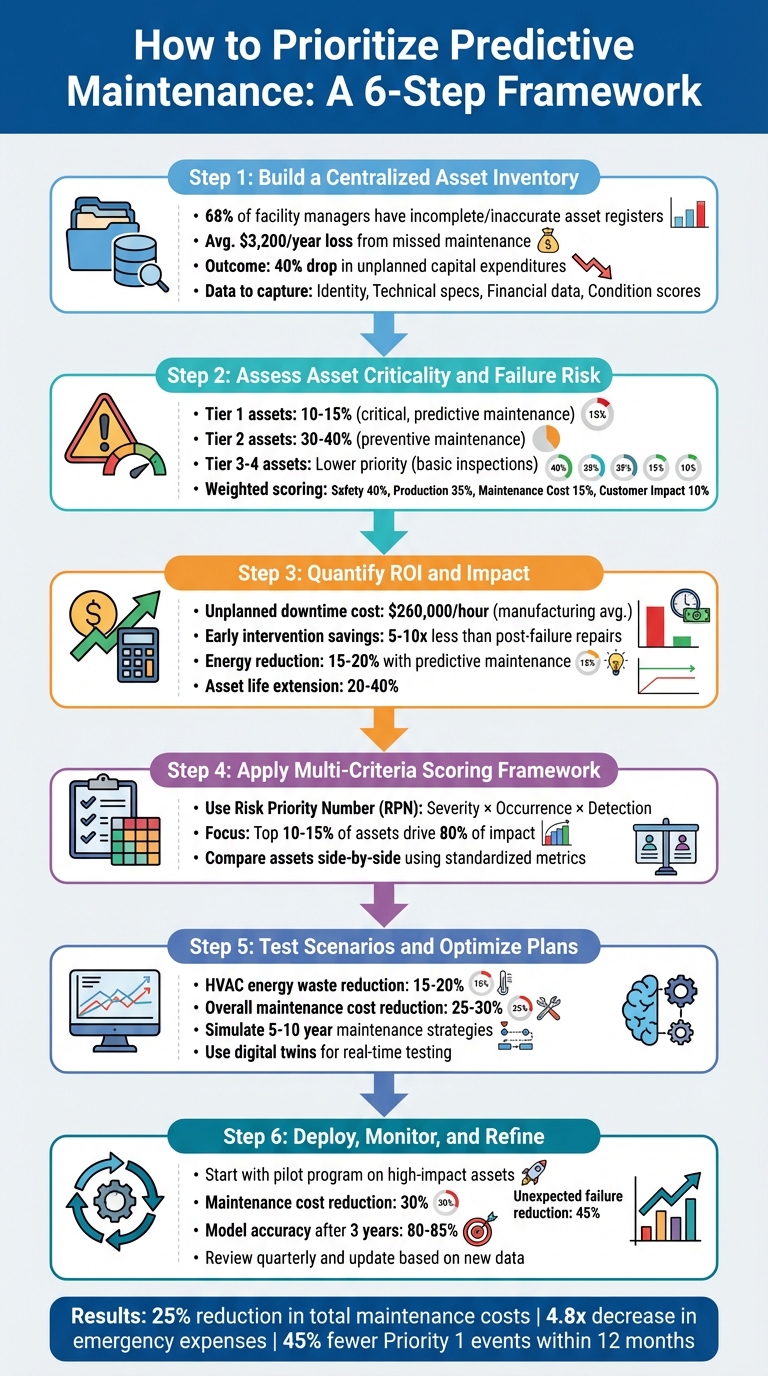
Quadro de 6 passos para dar prioridade à manutenção preditiva em todas as carteiras de activos
Como dar prioridade às actividades de manutenção preventiva?
sbb-itb-5be7949
Passo 1: Construir um inventário de activos completo e uma base de dados
A definição das suas prioridades começa com um inventário de activos sólido. Eis porquê: 68% dos gestores de instalações admitem que os seus registos de activos estão incompletos ou incorrectos. Essa lacuna pode custar uma média de $3.200 por ano devido à falta de manutenção preventiva, perda de reclamações de garantia e compras redundantes [9]. Sem um inventário centralizado, fica-se a adivinhar em vez de tomar decisões informadas.
"Um registo de activos de uma instalação não é uma lista de equipamentos. É a base de dados a partir da qual são tomadas todas as decisões de manutenção, programas de PM, ordens de trabalho e pedidos de renovação de capital." - John Polus [9]
Quando bem feito, um registo detalhado faz mais do que apenas listar os activos - fornece um contexto crítico. Diz-lhe onde cada ativo se encaixa no seu sistema, qual a sua importância, o seu historial de manutenção e o seu estado atual. Com este tipo de dados, as organizações registaram uma redução de 40% nas despesas de capital não planeadas e descobriram que 68% das despesas de capital reactivas poderiam ter sido previstas 6 a 12 meses antes [9].
Criar um registo centralizado de activos
Para começar, organize os seus activos numa hierarquia clara: Portfólio > Propriedade > Sistema > Ativo > Componente. Esta estrutura facilita a análise dos custos e das pontuações de estado, quer se esteja a focar numa única bomba ou a avaliar todo um portfólio de edifícios.
Para cada ativo, capte estes quatro tipos de dados principais:
- Identidade: Identificadores únicos, como números de etiquetas ou códigos QR.
- Técnica: Especificações, números de série e datas de instalação.
- Financeiro: Preço de compra, valor de substituição e custos de manutenção.
- Estado: Pontuações de saúde, datas de inspeção e quaisquer defeitos em aberto.
Este registo detalhado torna-se a espinha dorsal das informações de manutenção preditiva em que se baseará mais tarde.
Ferramentas como Inventário de Oxand Simeo pode simplificar o processo, consolidando tudo numa única plataforma pesquisável. Pode até importar dados em massa de folhas de cálculo em menos de duas horas. Além disso, a ferramenta normaliza os campos de dados em todo o seu portfólio - por isso, termos como "classificação de criticidade" significam a mesma coisa quer esteja a gerir uma ponte no Texas ou uma estação de tratamento de águas na Califórnia.
Quer facilitar a vida aos seus técnicos? Aplique etiquetas QR nos activos. Com uma leitura rápida, podem aceder a históricos de manutenção e manuais OEM, reduzindo os erros de atribuição de ordens de trabalho em 74% [9].
Normalizar as inspecções e a gestão da qualidade dos dados
Os dados inconsistentes são um grande obstáculo à manutenção preditiva. Por exemplo, se um inspetor classificar o tabuleiro de uma ponte como "regular" e outro o classificar como "mau", os seus modelos não podem gerar informações fiáveis.
A solução? Normalização. Utilizar uma escala universal de classificação do estado de conservação de 1 a 5 (5 = Excelente, 1 = Crítico) para todas as classes de activos [10]. Equipar os técnicos com formulários de inspeção guiados para garantir que a recolha de dados é consistente - mesmo offline. Quando voltam a ligar-se, o sistema sincroniza-se automaticamente. Ligar os manuais OEM diretamente aos registos de activos também poupa tempo, reduzindo as pesquisas de reparação em 30 a 90 minutos.
Os benefícios são claros. Se as reparações forem atrasadas para além do ponto de intervenção ideal (Condição 3) e o ativo atingir a falha (Condição 1), os custos de reparação podem disparar para 3 a 5 vezes mais [10]. Ao estabelecer estas bases, está a criar uma estratégia de manutenção fiável e baseada em dados.
Passo 2: Avaliar a criticidade dos activos e a probabilidade de falha
Depois de criar o seu inventário de activos, o passo seguinte é descobrir quais os activos que precisam da sua atenção em primeiro lugar. Nem todos os activos são criados da mesma forma - alguns são mais críticos, enquanto outros têm um maior risco de falha. Uma avaliação baseada no risco ajuda-o a concentrar os seus esforços de manutenção onde eles são mais importantes, abrindo caminho para avaliações detalhadas e estratégias preditivas.
Avaliar a criticalidade dos activos
A criticalidade dos activos mede o impacto da falha de um ativo. Para classificar os activos, considere factores como a segurança, o ambiente, a produção, a manutenção e os impactos regulamentares. A partir daí, calcular um Número de prioridade do risco (RPN) utilizando pontuações ponderadas. Um método de pontuação comum pode ser o seguinte:
- Segurança e impacto ambiental: ~40% peso
- Impacto na produção ou no serviço: ~35% peso
- Custo de manutenção: ~15% peso
- Impacto no cliente ou na regulamentação: ~10% peso [4]
"A criticidade do ativo mede a consequência da falha de um ativo (o quanto dói), enquanto o risco do ativo é a combinação dessa consequência e a probabilidade de ocorrência da falha." - Tim Cheung, CTO e cofundador, Fábrica de IA [4]
As organizações utilizam frequentemente um sistema escalonado para classificar os activos:
- Activos da Lista 1: Estes são os poucos activos críticos (cerca de 10-15% da carteira) cuja falha pode interromper as operações ou criar riscos de segurança e conformidade. Estes activos requerem normalmente manutenção preditiva e monitorização em tempo real.
- Activos da Lista 2: Cerca de 30-40% dos activos pertencem a esta categoria. Embora a sua avaria possa não parar tudo, pode ainda assim perturbar a produção. A manutenção preventiva é fundamental neste caso.
- Activos da Lista 3 e da Lista 4: Trata-se de activos de menor prioridade que podem frequentemente ser geridos com inspecções básicas ou mesmo com abordagens do tipo "run-to-failure".
Para garantir uma classificação justa e exacta, envolva uma equipa multifuncional no processo de avaliação. Lembre-se, esta não é uma tarefa única - reveja e actualize as classificações de criticidade a cada 12 a 18 meses ou sempre que ocorram alterações significativas, como mudanças nos níveis de produção ou novos regulamentos [2]. Estas classificações ajudá-lo-ão a determinar quais os activos que necessitam de atenção imediata.
Utilizar modelos probabilísticos para a previsão de falhas
Compreender a criticidade diz-lhe o que pode correr mal, mas conhecer a probabilidade de falha ajuda-o a prever quando pode acontecer. Para activos sem sensores IoT, pode ainda estimar as probabilidades de falha utilizando dados históricos, a idade do ativo e o estado atual [4][8].
Plataformas como a Oxand trazem décadas de experiência para a mesa, utilizando mais de 10.000 modelos de envelhecimento proprietários e 30.000 leis de manutenção criadas a partir de projectos reais. Estes modelos simulam a forma como os activos se degradam ao longo do tempo, tendo em conta variáveis como o tipo de material, as condições ambientais e a intensidade de utilização. Por exemplo, podem prever quando é que um componente pode passar de "Razoável" para "Fraco" ou mesmo para "Avariado" - muito antes de um sensor detetar um problema [6].
Tomemos como exemplo as pontes rodoviárias. Um modelo probabilístico pode prever que um determinado tabuleiro de ponte atingirá um estado crítico no prazo de 18 meses, com base no seu historial de inspecções, idade, carga de tráfego e exposição às condições meteorológicas. Se esta ponte também tiver uma pontuação de criticidade elevada, torna-se uma prioridade máxima para a manutenção.
Este método é particularmente útil para infra-estruturas que não dispõem de uma cobertura abrangente de sensores. Ao basear-se em informações baseadas em dados e na modelação preditiva, pode atribuir orçamentos de manutenção de forma mais eficaz a grandes carteiras - sem a despesa de instalar novo hardware.
Etapa 3: Quantificar o impacto da manutenção e a métrica do ROI
Depois de identificar os activos críticos e os respectivos prazos de falha, o passo seguinte é colocar números na sua estratégia de manutenção. Isto significa transformar os dados de risco em informações financeiras acionáveis e resultados mensuráveis. Ao traduzir os riscos dos activos em métricas financeiras e operacionais claras, pode tomar decisões informadas que se alinham com os seus objectivos.
Calcular os custos e as poupanças do ciclo de vida
O custo de uma avaria não se resume à substituição de peças - é muito mais abrangente. Para ter uma ideia completa, considere Custo total do tempo de inatividade (TDC). Isto inclui a perda de produção, horas de trabalho desperdiçadas, perdas de matéria-prima e a despesa de reiniciar as operações. Para contextualizar, o tempo de inatividade não planeado na indústria transformadora pode custar uns impressionantes $260.000 por hora em média [14]. Mesmo um pequeno atraso pode levar a perdas financeiras significativas.
O Curva P-F demonstra como a intervenção precoce pode poupar dinheiro - frequentemente 5 a 10 vezes menos do que o custo das reparações pós-falha [14]. Por exemplo, a substituição antecipada de um rolamento degradado pode custar $3.000, mas esperar até que este danifique a caixa de velocidades pode aumentar a despesa para $45.000 [15].
"A era das vagas ‘melhorias de eficiência’ acabou; as partes interessadas modernas exigem cálculos precisos sobre o custo total de propriedade (TCO) e o retorno sobre os ativos (ROA)." - Tim Cheung, CTO e cofundador, Fábrica de IA [14]
Eis um exemplo do mundo real: Em 2025, um fabricante de produtos de saúde no valor de $12,7 mil milhões implementou um programa piloto de quatro meses utilizando 234 sensores sem fios para monitorizar activos críticos. Os sensores detectaram cinco falhas importantes antes que elas ocorressem, evitando incidentes como um desalinhamento do eixo de acionamento do motor de $200.000 e uma falha no rolamento do motor de $154.000. O piloto poupou $405.500 em apenas 90 dias, proporcionando um ROI de 60× [15]. Além disso, o programa não necessitou de pessoal adicional, provando que a deteção precoce pode gerar retornos significativos sem aumentar as despesas gerais.
A manutenção preditiva também ajuda a reduzir os custos de inventário. Ao utilizar as previsões de vida útil restante (RUL) para encomendar peças "mesmo a tempo" em vez de as armazenar "só por precaução", as empresas podem libertar 15-20% de capital anteriormente ligado ao inventário [14]. Considerando que os custos anuais de transporte são normalmente de 20-25% do valor do inventário [14], Esta mudança pode conduzir a poupanças substanciais.
Uma regra prática simples pode orientar as decisões de manutenção: atuar quando a probabilidade prevista de falha excede o rácio entre o custo da manutenção pró-ativa e o custo da falha (P > k) [6]. Por exemplo, se uma reparação de $5.000 evita uma falha de $50.000 (um limiar de 10%), é um sinal claro para intervir precocemente.
Para além de evitar perdas financeiras, a manutenção preditiva também oferece benefícios energéticos e de sustentabilidade.
Modelo de redução de energia e resultados de sustentabilidade
A manutenção preditiva não se limita a poupar dinheiro - também reduz a utilização de energia e apoia os objectivos ambientais. O equipamento em mau estado consome frequentemente mais energia. Por exemplo, um motor avariado pode consumir 5-10% mais amperagem do que o normal, aumentando discretamente as facturas de serviços públicos [14]. A resolução precoce destes problemas pode restaurar o desempenho ótimo e reduzir o consumo de energia em 15-20% [16].
Um estudo de caso de um forno industrial mostrou como a manutenção preditiva baseada em IA reduziu o consumo de energia em 8% identificando as ineficiências antes que elas se agravem [11]. Estas poupanças de energia não só reduzem os custos, como também ajudam as organizações a atingir os objectivos de redução de carbono, fornecendo provas tangíveis do progresso em direção aos objectivos de sustentabilidade.
"Se houver uma iniciativa ESG, destaque as poupanças de energia e a redução de resíduos resultantes de menos falhas catastróficas. A tecnologia é a mesma - o enquadramento muda com base naquilo que interessa à liderança neste momento." - Monitorização [15]
A manutenção preditiva também prolonga a vida dos activos 20-40% [16]. Isto atrasa a necessidade de substituições dispendiosas, reduzindo tanto as despesas de capital como o impacto ambiental da produção de novos equipamentos. Em vez de substituir sistemas inteiros, as reparações específicas em componentes específicos mantêm os activos a funcionar durante mais tempo, minimizando o desperdício e o carbono incorporado.
Plataformas como Oxand Simeo™ tornam possível modelar esses resultados em escala. Ao simular o desempenho energético e as vias de redução de carbono em milhares de ativos, as organizações podem alinhar os investimentos em manutenção com suas estratégias de descarbonização de longo prazo. Essas ferramentas também geram relatórios prontos para auditoria, garantindo a conformidade com padrões como ISO 55001 e outros requisitos regulamentares.
Passo 4: Aplicar um quadro de priorização multi-critério
Agora que reuniu dados de risco, métricas financeiras e um inventário completo de activos, é altura de classificar os seus activos de forma objetiva. Esta etapa envolve a utilização de uma estrutura de priorização estruturada que combina risco, custo e outros factores num único sistema de pontuação. Ao fazê-lo, pode afetar recursos onde eles terão maior impacto - evitando decisões baseadas na intuição ou em políticas internas.
Desenvolver uma matriz de pontuação para definição de prioridades
Para refinar a classificação dos activos, crie uma matriz de pontuação com base nas suas métricas de risco e ROI. Um método amplamente utilizado é o cálculo de um Número de prioridade do risco (RPN) para cada ativo. Isto implica a multiplicação de três factores-chave:
- Gravidade: O impacto potencial do fracasso
- Ocorrência: A probabilidade de fracasso
- Deteção: A facilidade com que uma falha iminente pode ser identificada
Cada fator é normalmente classificado numa escala padronizada de 1 a 10 [3][5].
Para tornar os cálculos de RPN mais significativos, aplique critérios ponderados que reflictam as prioridades da sua organização. Por exemplo, pode atribuir os seguintes pesos:
- 40% para questões de segurança e ambiente
- 35% ao impacto na produção
- 15% para o custo de manutenção
- 10% para o Impacto no Cliente [4]
Isto garante que as questões críticas de segurança recebem a devida atenção, mesmo que impliquem custos mais elevados.
"As consequências em termos de custos não são apenas o custo da perda de produção e o custo da reparação, mas incluem também os custos relacionados com a segurança, o ambiente, a qualidade, a reputação da organização, etc." - Fiabilidade Web [5]
Para criar um processo de definição de prioridades completo, envolva equipas multifuncionais. Estas podem ajudar a identificar factores de risco adicionais - como longos prazos de entrega de peças ou riscos de conformidade ambiental - que de outra forma poderiam ser negligenciados. Esta abordagem colaborativa também garante uma visão completa da importância dos activos.
Concentrar-se nos activos que têm o maior impacto na empresa. Embora o Princípio de Pareto sugira que 20% de activos são normalmente responsáveis por 80% do impacto, uma análise mais aprofundada reduz frequentemente este número para apenas 10-15% de activos. Estes itens de elevado impacto são os que mais beneficiam de estratégias como a manutenção preditiva [2].
Utilizar tabelas de comparação para a tomada de decisões
Depois de padronizar as pontuações, as tabelas de comparação podem ajudá-lo a visualizar as soluções de compromisso e a tomar decisões orçamentais. Estas tabelas permitem-lhe comparar activos lado a lado - mesmo que sejam muito diferentes, como um tabuleiro de ponte versus um sistema AVAC [1][3].
Por exemplo, um tabuleiro de ponte pode ter uma pontuação elevada em Segurança (9/10) e Impacto na Produção (8/10), mas baixa em Detetabilidade (3/10). Isto resultaria num RPN elevado, indicando uma necessidade urgente de atenção. Entretanto, um sistema AVAC pode ter uma pontuação geral mais baixa, mas ainda assim justificar a manutenção preventiva devido à sua eficiência energética ou às necessidades de conformidade regulamentar.
Um estudo realizado em março de 2026 pelo investigador Thomas Wiese utilizou dados do Inventário Nacional de Pontes dos EUA para dar prioridade à manutenção. Ao integrar probabilidades de falha preditivas num modelo teórico de decisão e ao tirar partido da IA explicável (SHAP), o estudo destacou factores-chave como o estado do tabuleiro, o volume de tráfego e a idade da ponte como os principais factores de definição de prioridades [6].
Plataformas como a Oxand Simeo™ podem simplificar este processo, automatizando a pontuação multi-critério em carteiras inteiras. Estas ferramentas permitem-lhe simular diferentes cenários de ponderação - como dar prioridade à sustentabilidade a longo prazo em detrimento da poupança imediata de custos - para que possa afinar a sua estratégia de investimento.
Passo 5: Testar cenários e otimizar os planos da carteira
Depois de classificar os seus activos e analisar os riscos nos passos anteriores, é altura de simular diferentes cenários para validar o seu plano de manutenção. Ao executar estas simulações, pode avaliar o impacto dos diferentes níveis de orçamento, prazos e objectivos de sustentabilidade na sua carteira. Esta abordagem proactiva ajuda-o a evitar erros dispendiosos e assegura que a sua estratégia se mantém alinhada com as limitações financeiras e os objectivos a longo prazo.
Simular cenários orçamentais e de risco
Comece por analisar a forma como diferentes cenários orçamentais afectam a sua carteira. Por exemplo, compare os resultados de investimentos anuais mais baixos versus mais altos para ver o impacto nos níveis de risco, longevidade dos activos e eficiência energética. Ferramentas como o Oxand Simeo™ tornam possível executar estes cenários "e se" lado a lado, ajudando-o a identificar os riscos associados à manutenção diferida.
Concentre estas simulações em sistemas críticos - como o AVAC e a distribuição eléctrica - que têm o maior potencial para melhorar a eficiência. A manutenção preditiva com recurso à IA pode reduzir o desperdício de energia nos sistemas AVAC em 15-20% e reduzir os custos globais de manutenção em 25-30% através de uma melhor programação [12]. Ao começar com estes activos de elevado impacto, pode apresentar ganhos de sustentabilidade mensuráveis antes de implementar alterações em toda a sua carteira.
Os gémeos digitais acrescentam outra camada de precisão, simulando estratégias de manutenção em fluxos de trabalho em tempo real. Estes modelos de processos permitem-lhe testar o impacto de diferentes abordagens nas operações, permitindo-lhe afinar os seus planos antes de os pôr em prática [13].
"A análise preditiva... pode transformar a forma como a sua organização gere o risco e alcança a fiabilidade e a excelência do desempenho." - Jacqueline Vinyard, Diretora de Marketing de Produtos, GE Vernova [13]
A integração de alertas preditivos com o seu CMMS (Sistema de Gestão de Manutenção Computadorizado) também pode acionar ordens de trabalho automáticas quando são detectadas anomalias [12][18]. Estas acções imediatas criam as bases para a elaboração de estratégias plurianuais que se baseiem em dados e sejam reactivas.
Otimizar os planos de manutenção plurianuais
Utilize as informações das simulações de curto prazo para criar planos de longo prazo que equilibrem o risco, os custos e a sustentabilidade num período de 5 a 10 anos. Estes planos devem ter como objetivo prolongar a vida útil dos activos, programando intervenções no momento certo - nem demasiado cedo, nem demasiado tarde.
Mantenha os seus modelos de aprendizagem automática actualizados com os dados mais recentes para melhorar continuamente os planos de manutenção [12][18]. À medida que os activos envelhecem ou as condições de funcionamento mudam, a incorporação de novos dados garante que as suas estratégias permanecem eficazes. No caso de falhas recorrentes, realize análises da causa principal para resolver problemas subjacentes, como vibração crónica ou stress térmico, em vez de se limitar a tratar os sintomas [17].
Finalmente, compare o seu plano optimizado com a manutenção tradicional baseada no calendário. Muitas organizações que adoptaram a monitorização preditiva registaram uma redução de 25% nos custos globais de manutenção [12]. Esta comparação pode ajudar a quantificar as vantagens de uma abordagem baseada em dados, reforçando o valor da sua estratégia.
Passo 6: Implementar, monitorizar e aperfeiçoar os planos de manutenção
Depois de lançar as bases com a análise de dados, avaliações de risco e testes de cenários, é altura de pôr em ação a sua estratégia de manutenção. Mas não se trata de um processo do tipo "definir e esquecer". As organizações bem sucedidas tratam os seus planos de manutenção como documentos vivos que evoluem com novos conhecimentos e dados.
Implementação de planos de manutenção prioritários
Em vez de reformular toda a sua carteira de uma só vez, comece com um implantação faseada. Concentre-se em activos de elevado impacto - como uma linha de produção crítica ou uma classe de activos específica - e lance um programa-piloto. Isto permite-lhe medir o retorno do investimento e ganhar a confiança dos intervenientes antes de aumentar a escala [12][18][19]. Uma abordagem direcionada garante a demonstração de resultados tangíveis sem sobrecarregar os seus recursos.
Para garantir uma implementação sem problemas, crie um equipa multifuncional que inclui membros das Operações, Segurança/EHS, Engenharia e Aprovisionamento. Esta equipa ajudará a resolver todos os riscos potenciais, desde o tempo de paragem da produção até às preocupações de segurança [3]. Designe um grupo dedicado para tratar da implementação, libertando-o das tarefas de rotina para que se possa concentrar exclusivamente nesta iniciativa.
Integração com o seu CMMS (Sistema de Gestão de Manutenção Computadorizado) é imprescindível. Configure o sistema para gerar automaticamente ordens de trabalho com base nos dados dos sensores, criando uma ligação perfeita entre a previsão e a ação [18][3]. Antes do lançamento, limpe o sistema removendo as ordens de trabalho desactualizadas - tudo o que tenha mais de 90 dias.
Incentivar uma mudança cultural, destacando os benefícios da manutenção preditiva, como a melhoria do equilíbrio entre a vida profissional e pessoal e uma maior eficiência. Como Tim Cheung, CTO e cofundador da Factory AI, afirma:
"Um roteiro de manutenção já não se trata apenas de programar mudanças de óleo. Tem a ver com a transformação digital, a maturidade dos activos e a mudança da cultura de ‘arranjar coisas avariadas’ para ‘garantir a capacidade’." [19]
Ajude a sua equipa a ver as vantagens pessoais: menos reparações de emergência à noite e mais trabalho programado durante as horas normais. Esta mudança pode levar a uma maior satisfação no trabalho e a uma melhor moral [19].
Uma vez iniciada a implementação, a atenção deve passar a centrar-se no aperfeiçoamento dos seus planos à medida que os dados em tempo real ficam disponíveis.
Atualizar planos com base em novos dados
A manutenção preditiva não é estática - requer actualizações regulares. Reveja e aperfeiçoe os seus modelos preditivos todos os trimestres para ajustar os limites com base em novos dados operacionais [18]. Cada falha de equipamento deve levar a uma reavaliação dos factores de risco, incluindo actualizações das pontuações de Consequência de Falha e Probabilidade de Falha [21].
Abandonar as folhas de cálculo estáticas e adotar perfis de risco dinâmicos alimentados por telemetria IoT e dados de sensores. Estes perfis podem ajustar automaticamente o nível de risco de um ativo em tempo real, garantindo que as suas prioridades estão alinhadas com as condições actuais [21][4].
Gregory Perry, um Fiabilidade Fluke Especialista, aconselha:
"Assuma a propriedade das suas ferramentas de criticidade e sinta-se à vontade para ajustar os modelos para os tornar adequados à sua finalidade." [2]
Ao tratar a sua estratégia de manutenção como um documento vivo, irá garantir que esta se mantém relevante à medida que as suas operações evoluem.
Para medir o sucesso, monitorize os principais indicadores de desempenho. A manutenção orientada por dados pode conduzir a uma 30% redução dos custos de manutenção e um 45% diminuição das falhas inesperadas de equipamento [20]. Utilize estes parâmetros de referência para avaliar os seus progressos e aperfeiçoar a sua abordagem. Os modelos preditivos normalmente atingem Precisão 80-85% após cerca de três anos de recolha consistente de dados [7]. A paciência e a persistência são a chave para o sucesso a longo prazo.
Conclusão
Utilizando a estrutura de seis passos descrita neste guia, a manutenção deixa de ser um problema financeiro e passa a ser uma vantagem estratégica. Mesmo com uma grande carteira de activos, esta abordagem estruturada e orientada para os dados substitui os métodos reactivos e assegura que os seus activos mais críticos estão protegidos, mantendo os custos sob controlo.
Os números falam por si. As organizações que adoptam a definição estruturada de prioridades vêem frequentemente um Redução de 25% nos custos totais de manutenção, enquanto as despesas de emergência diminuem por um fator de 4.8x. Além disso, a obtenção de mais de 80% cumprimento da manutenção preventiva pode reduzir os eventos de emergência de Prioridade 1 45% em apenas 12 meses [22]. Estes resultados sublinham as vantagens de tratar a manutenção como um investimento estratégico e não como um encargo operacional.
Como Oxmaint afirma com propriedade:
"A maioria das carteiras não precisa de mais pessoal de manutenção. Precisam que a equipa existente trabalhe as tarefas certas pela ordem certa." [22]
Ao concentrar os recursos em activos de elevado valor, as organizações podem prolongar a vida útil dos activos, cumprir os requisitos de conformidade e trabalhar para atingir os objectivos de sustentabilidade - tudo isto sem aumentar o número de funcionários.
Plataformas como a Oxand Simeo™ tornam esta abordagem gerível à escala. Com mais de 10.000 modelos de envelhecimento proprietários e mais de 30.000 leis de manutenção desenvolvidas ao longo de duas décadas, a ferramenta prevê como os ativos se deterioram e falham ao longo do seu ciclo de vida. Isto permite aos utilizadores testar cenários orçamentais, planear estratégias plurianuais e alinhar as despesas de manutenção com a eficiência energética e os objectivos de redução de carbono - tudo num único sistema centralizado. Esta combinação de análises poderosas e ferramentas práticas garante resultados consistentes e impactantes.
A principal conclusão? Comece com pouco, acompanhe o seu progresso e desenvolva o que funciona. Quer esteja a supervisionar estradas, edifícios ou pontes, um quadro estruturado de definição de prioridades garante que cada dólar gasto proporciona um valor mensurável - tanto para os seus activos como para o seu desempenho financeiro.
FAQs
De que dados necessito para começar a dar prioridade à manutenção preditiva?
Para se concentrar na manutenção preditiva, comece por recolher dados sobre três factores-chave: criticidade dos activos, probabilidade de falha, e impacto na manutenção. Isto significa avaliar a importância de cada ativo para as suas operações, as hipóteses de falhar e as potenciais consequências se tal acontecer. Ao efetuar uma análise de criticidade, pode classificar os activos com base na prioridade, garantindo que os mais urgentes recebem a atenção de que necessitam em primeiro lugar. A adoção desta abordagem baseada em dados permite-lhe racionalizar os esforços de manutenção, melhorar o retorno do investimento e minimizar os riscos em todos os seus activos.
Como classificar a criticidade quando as equipas não estão de acordo quanto à importância dos activos?
Quando as equipas não conseguem chegar a acordo sobre a importância dos activos, é essencial recorrer a uma abordagem estruturada e baseada em dados para manter a objetividade. Comece por definir critérios claros - pense impacto operacional, consequências da falha, e custos de manutenção. Uma matriz de pontuação ponderada funciona frequentemente bem para este efeito.
Para tornar o processo ainda mais exato, introduza dados em tempo real e registos históricos de falhas. Isto ajuda a reduzir as opiniões subjectivas e coloca todos na mesma página. A utilização de uma estrutura consistente garante que as pontuações de criticidade estão associadas a prioridades mensuráveis, o que conduz a decisões melhores e mais informadas.
Como é que posso provar o ROI da manutenção preditiva sem sensores IoT?
É possível provar o ROI sem depender de sensores IoT, concentrando-se em métricas-chave como custos de falhas de base, poupanças de intervenção e resultados tangíveis. Comece por acompanhar as taxas de avaria, as despesas de manutenção e o tempo de inatividade antes e depois de implementar as suas estratégias. Crie uma estrutura clara que associe acções específicas a poupanças mensuráveis - como a redução do tempo de inatividade, a minimização das reparações de emergência ou o aumento da vida útil dos activos. Esta abordagem permite-lhe demonstrar o ROI através de economias de custos documentadas e resultados claros e quantificáveis, mesmo na ausência de dados obtidos através de sensores.
Publicações do blogue relacionadas
- A manutenção preditiva para a gestão de activos (infra-estruturas e bens imobiliários) é fundamental - utilize o sítio Web: https://theiam.org
- Manutenção preditiva e ROI
- Como calcular o ROI real da manutenção preditiva (e introduzi-lo no seu plano de investimento)
- Dos dados às decisões: Transformar a análise de activos em poupanças de CAPEX