


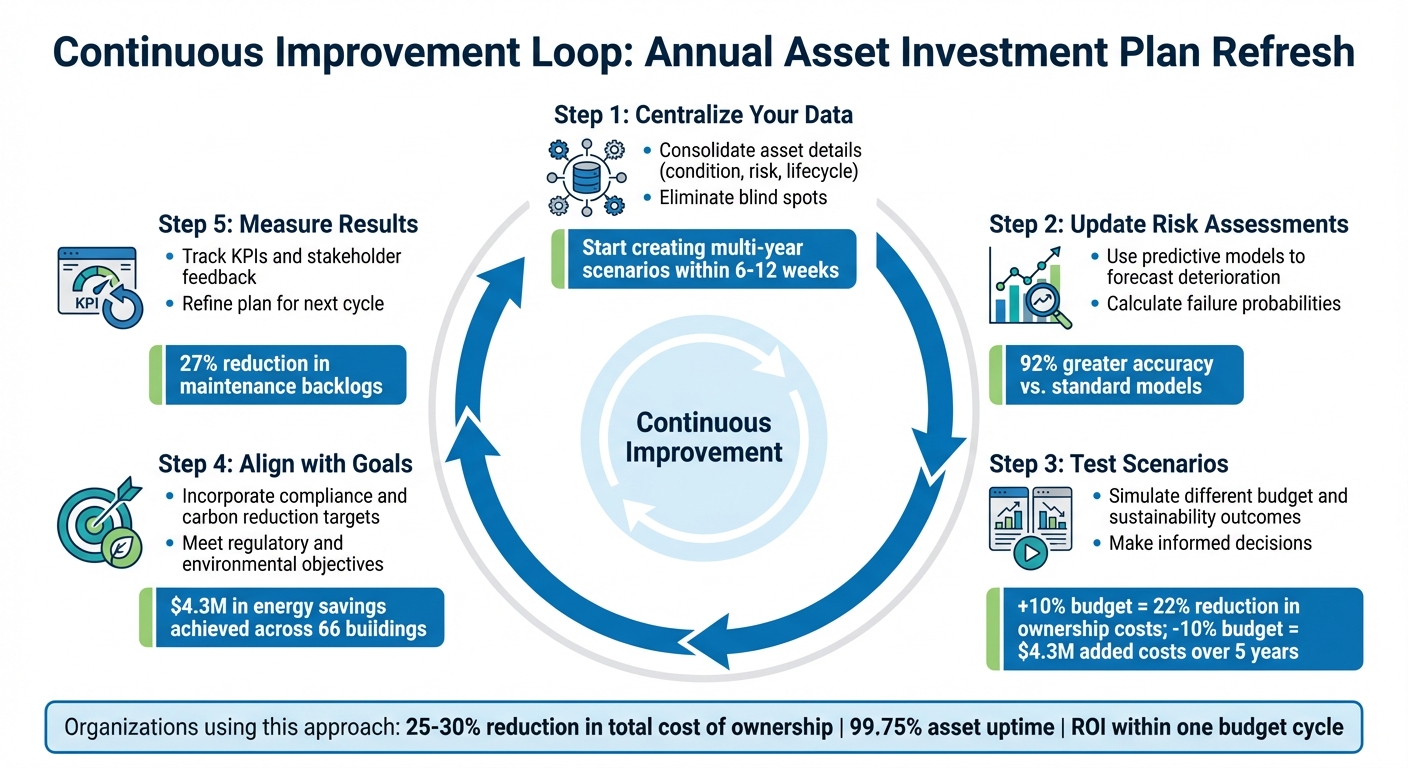
Want to avoid costly asset failures? Start by refreshing your investment plan annually. Here’s how you can stay ahead with a simple, data-driven approach:
- Centralize Your Data: Consolidate asset details like condition, risk, and lifecycle into one system to eliminate blind spots.
- Update Risk Assessments: Use predictive models to forecast asset deterioration and calculate failure probabilities.
- Cenários de teste: Simulate different budget and sustainability outcomes to make informed decisions.
- Align with Goals: Incorporate compliance and carbon reduction targets directly into your planning process.
- Measure Results: Track performance with KPIs and stakeholder feedback to refine your plan for the next cycle.
Key Insight: Organizations using tools like Oxand Simeo™ have reduced maintenance backlogs by 27% and achieved millions in energy savings. A proactive approach not only cuts costs but also improves long-term asset reliability.
Ready to dive deeper? Let’s break down each step.
5-Step Annual Asset Investment Plan Refresh Process
Asset Management Business vs Strategic Investments
sbb-itb-5be7949
Step 1: Start with Clean, Centralized Asset Data
The strength of your investment plan depends entirely on the quality of your data. If your data is scattered across systems, it creates blind spots and leads to poor decision-making. To avoid this, you need a single, consolidated source of information that combines details like condition, risk, and lifecycle data.
Criar um registo de activos centralizado
In many organizations, asset data lives in silos. Finance might track replacement costs in one system, operations logs work orders in another, and energy teams rely on their own spreadsheets. This fragmented setup makes it nearly impossible to get a complete view. A centralized asset register solves this by bringing everything together – inventory details, structural attributes, condition scores, and performance metrics all in one place.
Ferramentas como Inventário Oxand Simeo™ make this process easier. They connect with existing systems through REST and GraphQL APIs, so you don’t have to manually re-enter data. Instead, you can automatically sync information from ERP, CMMS, GIS, BIM, or IoT sensors. With this approach, organizations can start creating multi-year investment scenarios within 6 to 12 weeks of importing data [2]. The platform also offers automated import tools and templates, allowing you to bulk-load legacy spreadsheets or CMMS exports in just days instead of months [1].
"Simeo reduced our maintenance backlog by 27% and enabled us to achieve $4 million in energy savings across 66 buildings during the first budget cycle." – Asset Director, Public Sector Portfolio [1]
Conduct Regular Condition Assessments
Relying on paper inspections can slow you down, lead to inconsistent scoring, and increase the risk of lost data. Digital tools like Simeo GO streamline the process by standardizing inspections. Field teams can access asset data, perform inspections, and upload photos and condition scores directly from their mobile devices – even when offline. The data syncs to the cloud in near real-time, ensuring your asset register always reflects the latest conditions [1][2].
Switching to digital tools also saves time. Field data collection can be up to 50% faster [1]. Plus, standardized scoring ensures consistency – a "fair" rating in one building means the same in another. This uniformity is essential for prioritizing infrastructure asset management investments across a portfolio.
Apply Data Quality Controls
Even with digital tools, errors can sneak in. Duplicate entries, missing fields, or inconsistent formats can undermine your confidence in the data. That’s where data quality controls come in. Validation rules and standardized formats help ensure accuracy and completeness as data is entered or synced [2]. Role-based access control (RBAC) and detailed audit logs track changes, showing who modified data and when. This ensures accountability and compliance [1][2].
These measures not only prevent errors but also build trust among stakeholders. With reliable data, organizations can reduce their total cost of ownership by 25% to 30% [2]. Automated audit trails can also cut preparation time for audits by up to 70% [1]. This can be the difference between scrambling to justify your budget and confidently presenting data-backed recommendations.
With a strong foundation of clean and centralized data, you’re ready to tackle risk assessments and forecast deterioration rates in the next step.
Step 2: Update Risk Assessments and Deterioration Forecasts
Once your data is organized and centralized, the next move is to forecast asset deterioration and refine your risk assessments. Assets don’t age uniformly – factors like condition, environment, and maintenance history all play a role. Without accurate forecasts, deciding which projects to fund can feel like a guessing game. Predictive models help eliminate this uncertainty by calculating failure probabilities based on actual condition data. This sets the foundation for a more detailed and effective risk analysis.
Use Predictive Models to Analyze Risk
Traditional lifecycle curves often assume that all assets age the same way, which doesn’t account for varying conditions. Oxand’s platform takes a different approach. It uses over 10,000 proprietary aging models and 30,000 maintenance laws – built over two decades – to capture a wide range of asset deterioration patterns [4]. Instead of offering a rough guess about when an asset might fail, these models dig into historical inspection data to calculate precise failure probabilities.
This step-by-step method avoids the pitfalls of relying on broad population curves. For instance, a stepwise Weighted Slope model has been shown to predict asset degradation with 92% greater accuracy compared to standard continuous models [4]. By improving prediction accuracy, these models allow for better resource allocation and fewer unexpected failures.
Recalculate Failure Probabilities Annually
Asset conditions evolve over time, so it’s important to revisit failure probabilities every year. As part of an ongoing improvement process, this annual update ensures your model reflects the most current conditions. Start by filtering out assets that were repaired or replaced during the year – this keeps the model focused on genuine aging patterns, rather than skewed data from artificial improvements [4].
Next, integrate updated condition scores to refine the degradation slope. For assets with limited historical data, a Nearest Neighbor approach is applied, expanding the search until enough comparable data is found [4]. The model also uses proximity weighting, looking four years ahead to calculate a weighted average of expected conditions. This smooths out short-term data fluctuations and improves accuracy [4].
These updated forecasts provide a solid basis for testing investment scenarios and prioritizing projects with confidence.
Step 3: Test Investment Scenarios Against Multiple Criteria
To make informed decisions, it’s crucial to test investment scenarios against real-world constraints, factoring in updated risk forecasts. Challenges like budget limits, carbon reduction goals, and service-level requirements often conflict, pulling priorities in different directions. Running scenario simulations helps you compare these trade-offs side by side. For instance, you can explore the impact of a tight budget versus increased funding or assess what’s needed to achieve carbon reduction targets while maintaining reliability.
Run Budget and Sustainability Scenarios
Using your updated risk forecasts, simulate various budget and sustainability scenarios to see how different approaches may play out. Tools like Oxand Simeo™ allow organizations to model scenarios with different funding levels and decarbonization pathways. For example, one utility tested three funding levels: flat, +10%, and -10%. Under a flat budget, they projected modest short-term reliability improvements but anticipated higher long-term costs and risks. The +10% budget scenario resulted in a 22% reduction in total ownership costs by focusing on refurbishing high-risk units. On the other hand, the -10% budget scenario added $4.3 million in costs over five years due to delayed replacements and emergency repairs [3].
Similarly, the University of Adelaide adopted this approach, running iterative simulations to pinpoint the funding level that would maintain desired service levels while balancing fluctuating investment needs and affordability [5]. This kind of analysis provides decision-makers with a clear understanding of what they gain – or risk – at each funding level.
Once scenario outcomes are evaluated, the next step is ranking and prioritizing individual projects to align with your organization’s goals.
Rank Projects Using Multiple Criteria
After running scenario simulations, prioritize projects based on multiple factors, including risk levels, lifecycle costs (CapEx + O&M), energy performance, and CO₂ impact. By ranking projects across these criteria, you can ensure investments align with your strategic objectives.
Shifting from traditional age-based replacement schedules to a data-driven approach allows you to focus on assets that pose the highest risks or promise the greatest returns. This predictive prioritization helps allocate resources more effectively, moving away from reactive repairs and directing efforts where they will deliver the most value.
Step 4: Align Plans with Sustainability and Compliance Requirements
After ranking your projects, it’s time to align them with your organization’s long-term goals for sustainability and compliance. Instead of treating decarbonization and regulatory requirements as separate tasks, incorporate them directly into your annual investment plan. This approach ensures that reducing carbon emissions and meeting compliance standards are woven into every decision, rather than being treated as afterthoughts.
Model Carbon and Energy Reduction Pathways
Evaluate how each investment impacts your carbon footprint. Tools like Oxand Simeo™ use 10,000 proprietary aging and energy laws to simulate energy and carbon reduction scenarios. This helps quantify savings in terms of kilowatt-hours (kWh) and greenhouse gas (GHG) emissions for each maintenance or modernization project [1]. For instance, one public sector portfolio achieved $4.3 million in energy savings across 66 buildings while also cutting carbon emissions – clear, measurable results tied to their investment choices [1].
Rather than seeing sustainability as a mere compliance requirement, use it as a strategic framework. Run simulations to test how various funding levels align with carbon reduction goals. This method balances the need to manage immediate budgets with the responsibility of meeting environmental objectives.
Generate Compliance Documentation
Compliance with standards like ISO 55001 demands consistent, risk-based documentation and clear audit trails. Instead of preparing reports manually during audits, leverage tools that automate this process using the same data used for investment planning.
Por exemplo, Oxand Simeo™ includes ISO 55000 checklists and can generate audit-ready reports with a single click. By automating compliance documentation, the platform tracks key regulatory metrics and creates transparent audit trails for every decision. This ensures that your plans are always ready for audits, saving time and reducing stress throughout the year.
Step 5: Measure Results and Close the Loop
The last step in your annual refresh cycle is all about reviewing outcomes. By comparing actual results to your original plans, you can spot what worked, what didn’t, and avoid repeating mistakes. This evaluation helps fine-tune your strategy for the next cycle.
Track Performance with KPIs
Start by analyzing whether your investment plan delivered as expected. Use key performance indicators (KPIs) that connect asset conditions to real-world outcomes. These might include metrics like service interruption risk, total cost of ownership (TCO), uptime, or CO₂ savings [3].
Tomar o Louisiana Offshore Oil Port (LOOP LLC) as an example. They achieved a 99.75% uptime on their main oil line assets in 2013 and consistently maintained over 98% uptime for nearly a decade. They also set a five-year reduction goal per barrel and exceeded it, achieving a 15% reduction three years early and eventually cutting over 30% compared to their 2012 baseline. Beyond numbers, qualitative insights add depth. In 2018, even while handling 940 million barrels of crude, their strict environmental KPIs resulted in a total release volume of only 0.02 ounces [6].
To stay ahead, adopt a rolling 12-to-18-month planning model. Recalibrate quarterly based on actual failures, work history, costs, and available resources. This approach helps identify trends like unexpected asset wear or risks from delayed projects [3].
Incorporate Stakeholder Feedback
Numbers alone don’t tell the whole story. Combine KPI data with stakeholder feedback for a well-rounded evaluation. Talk to internal teams, board members, and external partners to understand what went right and where things fell short. Ask specific questions: Were there bottlenecks during handoffs? Did governance meetings lead to decisions or just updates? What caused delays in certain projects? [8]
"The difference between a strong year and a difficult one often comes down to whether the organization focuses on the right few priorities and executes them consistently." – Michelle Kellett, Corporate Analyst [8]
Treat prioritization as an ongoing process, not a once-a-year task. Revisit your trade-offs and priorities regularly to adapt to changing conditions or challenges. Also, document any assumptions made during the planning process when data was unavailable. This ensures they can be verified or corrected in the next cycle [7].
Conclusão
Updating your asset investment plan builds on the foundation of past insights. By shifting from static audits to a dynamic, ongoing process, you can create a living document that reflects real-world conditions, budget changes, and evolving goals. Start with clean, centralized data, refresh risk models annually, test different investment scenarios, align with compliance and carbon reduction objectives, and measure outcomes to refine your approach. This cycle not only improves efficiency but also delivers measurable savings in both costs and energy use.
This loop-based planning approach helps reduce ownership costs, tackle maintenance backlogs, and enhance energy efficiency. Many organizations adopting this method have seen tangible improvements within a single budget cycle, proving the power of data-driven infrastructure asset management.
With Oxand Simeo™, the entire process becomes easier. The platform simplifies planning, data collection, and reporting, enabling most organizations to launch their first multi-year investment scenarios in under two weeks. Many see a full return on investment within one budget cycle. Additionally, Oxand’s consulting services help teams transition from scattered spreadsheets to structured, data-driven plans in less than six months, ensuring long-term success.
Effective asset management requires treating planning as a continuous process rather than a once-a-year task. By embracing this approach, your investment decisions will remain grounded in accurate data, aligned with your organization’s goals, and ready to stand up to scrutiny from any stakeholder.
FAQs
What data should I centralize first?
Start by bringing your asset inventory into one central location. This approach provides a clear and comprehensive view of all your assets, making it easier to make informed investment decisions and manage risks effectively. Having centralized data is crucial for assessing asset conditions, planning maintenance schedules, and determining which investments should take priority – essential tasks when revisiting and updating your asset investment plan each year.
How do I update failure risk each year?
To keep failure risk assessments current in your asset investment plan, take a risk-based approach that focuses on asset health, failure causes, and operational risks. Make it a habit to review asset performance, maintenance records, and lifecycle projections regularly to pinpoint potential issues. Using real-time data and a flexible framework can help ensure your evaluations stay precise and aligned with your long-term investment objectives.
Which KPIs prove the plan worked?
Key performance indicators (KPIs) that highlight success include reducing long-term risks, cutting costs, boosting reliability, e strengthening operational resilience. You can track these outcomes using tools like scenario analysis and performance monitoring to confirm the plan is delivering measurable benefits.