


If I had to sum up the article in one line: rank every renewal need in one list, fund the highest-risk work first, and map it across 3 to 10 years.
That’s the core answer. When money is tight, I would not approve projects building by building based on who complains the loudest. I would use one scoring method across the whole portfolio, group work by system, test budget scenarios, and schedule projects in the right order. That helps stop small repairs from turning into large failures.
Here’s the short version:
- Start with a minimum data set for every building and system
- Score each backlog item using risk, service impact, deterioration, and cost
- Add energy use and carbon needs so repair plans do not ignore EU renovation rules
- Test 3 funding paths: minimum compliance, risk stabilization, and full renewal
- Sequence work by dependency so roofs come before HVAC, and shutdown-heavy work fits site use
- Update the roadmap every year with new inspections, completed work, current costs, and energy data
A few numbers from the article make the case fast:
- A $50,000 planned fix can avoid a $500,000 failure within 2 years
- About 34% of deferred maintenance backlog often falls into the urgent group
- EU public buildings face a 3% annual energy renovation rate
- Non-residential buildings in Europe use about 40% more energy than residential buildings
- When FCI goes above 0.30, replacement often makes more sense than repair
I’d frame the article like this: first build the data, then rank the backlog, then test budget levels, then set delivery order, then log every assumption. That gives you a clear reason for what to do now, what to defer, and how to explain each choice to finance and audit teams.
| Step | What I’d do | Why it matters |
|---|---|---|
| 1 | Build one data set across all sites | So every asset is judged the same way |
| 2 | Rank backlog items with weighted scoring | So high-risk work moves first |
| 3 | Add energy and carbon factors | So repairs line up with policy and lower energy use |
| 4 | Test funding scenarios | So leaders can see what each budget level buys |
| 5 | Sequence by dependency and site disruption | So work happens in the right order |
| 6 | Review every year | So the plan stays current |
If you manage schools, hospitals, offices, or mixed public assets, this is the main lesson: do not build the plan project by project. Build it portfolio first.
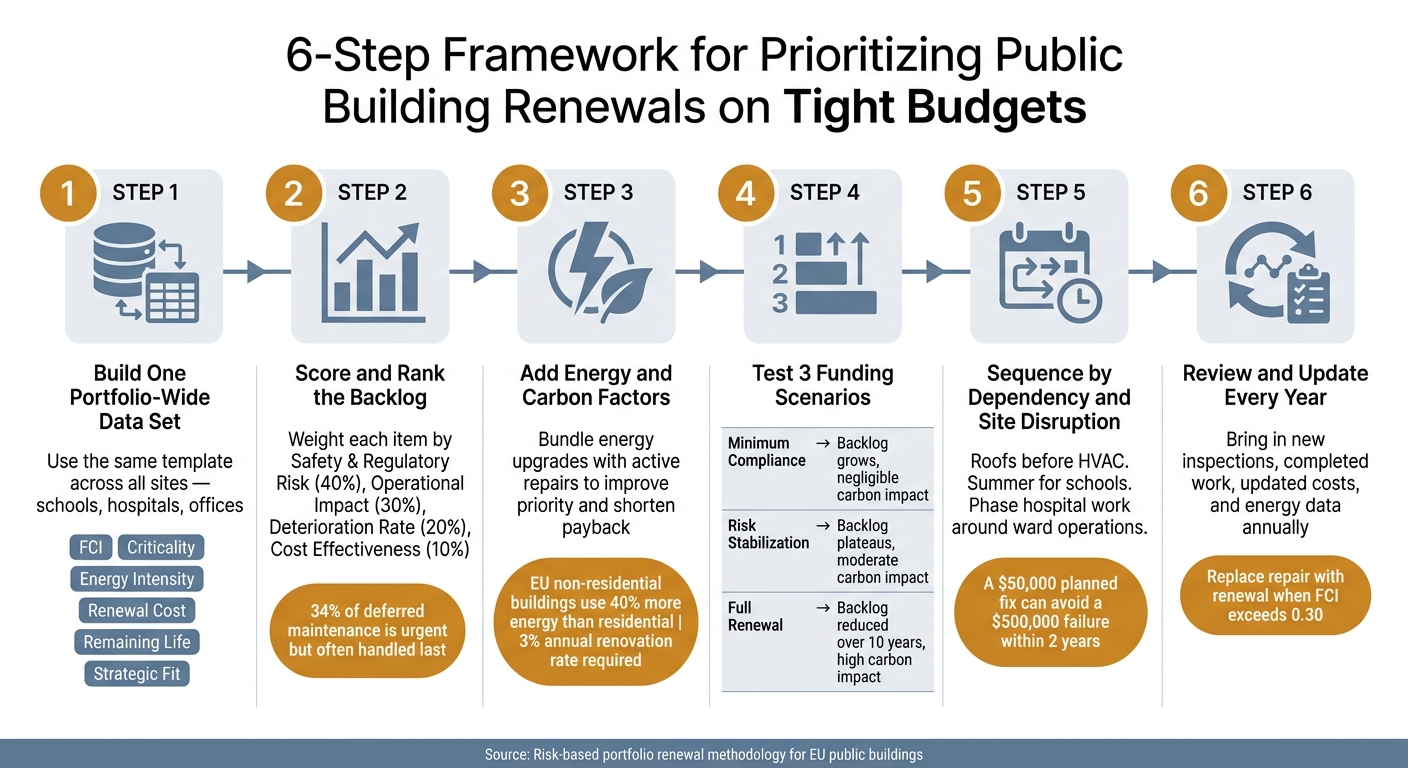
6-Step Framework for Prioritizing Public Building Renewals on Tight Budgets
Build the Minimum Data Set Needed for Portfolio Decisions
When budgets are tight, you need one scoring method for every building. That means using the same template across the whole portfolio, so schools, hospitals, offices, and other assets can be weighed on equal terms. This is the minimum data set needed to build a risk-based renewal roadmap.
Define the core data fields that drive investment decisions
The Facility Condition Index (FCI) is the standard place to start. It’s calculated as the cost of repairs divided by the replacement value [3]. The higher the FCI, the more urgent the need. Add a criticality score – how much a failure would affect safety, compliance, or service continuity – and you now have the two main inputs for ranking assets.
Four more fields round out the minimum set:
| Data Field | Decision Role | Description |
|---|---|---|
| Condition | Urgency | Shows physical deterioration and repair urgency |
| Criticality | Service impact | Flags consequences of failure on safety and operations |
| Energy intensity | Decarbonization | Identifies high-consumption assets for retrofit |
| Renewal cost | Budget planning | Estimates capital needed for repair or replacement |
| Remaining life | Lifecycle timing | Predicts when an asset reaches end of functional service |
| Strategic fit | Long-term goals | Factors in regulatory requirements and sustainability targets |
Taken together, these fields help answer the questions portfolio teams deal with every day: What needs attention now? What can wait? And where will each $1 go the farthest?
Organize data by system, not just by building
Don’t stop at the building level. Group assets by a shared hierarchy – roofing, HVAC, electrical, plumbing – so you can compare the same systems across sites and rank them in one backlog.
This matters in practice. If several roofs or HVAC systems show high FCI scores, you can bundle that work, cut mobilization costs, and line it up around one lifecycle window. It also makes blind spots easier to see. If one site has thin HVAC data and another has none for roofing, the structure makes those gaps hard to miss.
Fill data gaps without delaying action
Start with what you already have: inspection reports, maintenance logs, and energy bills. That usually gets you farther than people think.
When condition data is missing, estimate wear based on age and maintenance history using Ross, Unger, or Eytelwein methods [2]. When cost data is missing, use standard replacement-cost tables or costs from similar projects. In each case, record the method used for the estimate so the result can be audited later.
Once the data set is consistent across the portfolio, you can rank the backlog by risk, criticality, and cost.
sbb-itb-5be7949
Rank the Backlog by Risk, Criticality, and Cost
Use the portfolio data you’ve already pulled together and score each backlog item the same way. The goal is simple: one repeatable method that can stand up to finance and audit review.
Use a prioritization matrix to separate urgent from deferrable work
Score each backlog item against four weighted criteria: Safety & Regulatory Risk (40%), Operational Impact (30%), Deterioration Rate (20%), and Cost Effectiveness (10%) [4]. Those weights match the reality of public buildings. A compliance breach or structural issue will almost always matter more than an efficiency improvement.
After scoring, place each item into one of four planning bands:
| Priority Band | Timeframe | Typical Triggers |
|---|---|---|
| Immediate | 0–1 year | Safety hazards, active compliance breaches, structural risk |
| Short-term | 1–3 years | High deterioration rate, FCI above 0.10, knock-on failure risk |
| Medium-term | 3–5 years | Declining condition, approaching end of service life |
| Long-term / Monitor | 5–10 years | Planned lifecycle replacements, low failure probability |
On average, 34% of deferred maintenance backlogs qualify as immediate or urgent, but they often get handled last because there’s no formal scoring system in place [4]. A matrix fixes that. It turns a pile of requests into one ranked queue across the whole portfolio.
Factor in energy and carbon to avoid short-sighted decisions
Energy performance should be part of the same ranking. Non-residential buildings in Europe have an average specific energy consumption 40% higher than residential buildings [6]. On top of that, EU Directive 2018/2002 requires state administrations to ensure an annual energy efficiency renovation rate of 3% of the total useful floor area of heated/cooled buildings [6].
Here’s the practical point: when a renewal already deals with a failing component, energy work should move up the list if it can be bundled with that renewal. That improves the asset’s overall priority and can shorten payback periods [5]. In plain terms, if you’re already opening the wall, replacing the unit, or redoing the roof, pair the energy upgrade with the repair.
Apply the method to common public-building cases
Three common cases show how different risk profiles can lead to very different timing decisions.
A school roof in the Poor condition band moves into the immediate queue because delay drives up cost fast. Put off roof membrane or water-ingress repairs for even six months, and repair costs can jump by 3 to 5 times [4].
An aging hospital air-handling unit might not yet have a critical FCI score, but continuity of service matters a lot in a hospital. That consequence score can push it into the short-term band even if wear alone wouldn’t.
An obsolete office electrical panel scores high on safety and compliance. Switchgear and panel upgrades hit high-risk territory at an FCI of around 0.07, or 7% of replacement value [4]. At that point, fire risk and the chance of a full power outage make a near-term budget case much easier to defend.
The ranking should come from the combined score, not from any one metric on its own. Use that ranked list to test funding scenarios and shape the multi-year CAPEX plan.
Test Funding Scenarios and Build a Multi-Year CAPEX Plan
Once the backlog is ranked, the next step is simple: see what each budget level actually gets you. Before you lock the plan, test a few funding scenarios.
Compare three scenarios: minimum compliance, risk stabilization, and full renewal
Use the same scoring list across three budget envelopes so the comparison stays apples to apples.
| Budget Scenario | Risk Effect | Service Effect | Backlog Trend | Carbon Impact |
|---|---|---|---|---|
| Minimum Compliance | Addresses only immediate health and safety and legal failures | High risk of unplanned closures due to system failures | Backlog continues to grow significantly | Negligible; focus is on like-for-like repair |
| Risk Stabilization | Prevents new critical risks by addressing assets at end of life | Improved reliability; fewer emergency repairs | Backlog plateaus or grows slowly | Moderate; includes some high-efficiency upgrades |
| Full Renewal | Eliminates high and medium risks across the portfolio | Optimal service delivery and occupant comfort | Backlog is systematically reduced over 10 years | High; integrates deep retrofits and decarbonization |
Minimum compliance deals with urgent legal and safety failures only. It keeps the doors open, but not much more.
Risk stabilization goes a step further. It stops new critical risks from building up, without replacing every aging asset on a full lifecycle basis.
Full renewal is the longer-range goal. In most cases, you won’t fund it all at once. You phase it in over time.
Sequence projects by dependency and disruption risk
After you know what sits at the top of the list, you need to decide the delivery order. Ranking tells you what matters most. Sequencing tells you what happens first.
The first rule is clear: life-safety and compliance items go first. After that, technical dependencies shape the order. Envelope work, like roofing, should come before HVAC upgrades [2]. If several projects share access needs, shutdown windows, or permits, bundle them instead of splitting them across separate contracts [1].
Site use matters just as much as engineering logic. A school roof replacement makes more sense in summer. A hospital plant room upgrade has to be phased around ward operations [1]. When timing lines up with how people use the building, disruption drops and delivery gets easier.
Turn the preferred scenario into a 3 to 10 year funding roadmap
Now turn the ranked backlog into annual spending bands tied to risk reduction. The same urgency bands can shape each CAPEX phase.
- Immediate phase: absorb all critical safety and compliance items.
- Short-term phase: deal with end-of-life systems and high-deterioration components.
- Medium-term phase: replace satisfactory-but-declining assets before failure. Use component life spans to time the work: roofs 20–25 years, boilers 15–20 years, electrical systems 30–40 years, and windows 25–30 years [1].
- Long-term phase: lock in planned lifecycle replacements and energy upgrades so future spending spikes don’t hit all at once.
Long-range scheduling and bundling cut whole-life cost [2]. Spread large projects across multiple years to avoid budget spikes. Where possible, use a sinking fund – capital set aside each year – to keep the long-term scope affordable [1][2].
Each phase should show the risks it reduces and the service continuity it protects. That makes the roadmap easier for finance teams and auditors to follow.
Document the assumptions now so you can refresh the roadmap later without rebuilding the whole thing.
Keep the Plan Credible and Up to Date
Document the decision logic for audit and budget approval
Once the CAPEX roadmap is set, the job isn’t over. Now you need to make sure people can audit it, review it, and approve the budget without guesswork.
Use the same scoring model to explain why each project made the cut. Then tie every funded project to one measurable driver: risk reduction, avoided failure cost, compliance, or energy savings [7].
Use FCI as the shared condition benchmark across the plan. When FCI goes above 0.30, replacement will often make more sense than continued repair [4].
It also helps to keep an assumptions log. Track the unit-cost source, renewal interval, cost class, and risk score for each item. Back that up with surveys, compliance records, and maintenance logs [7]. That way, if someone asks, “Why did this project move up the list?” you have a clear paper trail.
Refresh the roadmap every year rather than rewriting it from scratch
Treat the roadmap like a living document, not a five-year exercise that gets rebuilt from zero every time.
Update it on a fixed annual cycle. Each year, bring in four inputs:
- new inspection results
- completed work
- updated unit costs
- current energy performance data [1]
Use rule-based renewal triggers so the schedule can roll forward on its own as intervals shift [7]. That keeps the plan current without turning each annual update into a full redo.
Conclusion: What to renew first, what to defer, and how to justify the choices
This guide follows five steps: build a clean, system-level data set; rank the backlog using risk, criticality, and cost; test budget scenarios against realistic funding envelopes; sequence projects by dependency and disruption risk; and document the decision logic so every choice is traceable.
Limited funding doesn’t mean you have to make random cuts. It means making tradeoffs in plain view, using current data, and giving each decision a clear reason.
FAQs
How much data do I need to start?
Start with a centralized asset inventory that uses the same record format across your portfolio. Don’t wait for perfect data. Get the basics in place first, then link each asset to the building systems tied to your main risks and biggest costs.
Next, build a steady baseline with a 1 to 10 condition score. Use inspection results, asset age, failure history, and staff input to set that score. Then layer in 12 to 36 months of work order data, current replacement costs, and any compliance or energy performance metrics.
When should I repair versus replace?
Don’t base the call on age alone. Use the data.
Start a formal review when an asset’s condition score drops to 3/10 or lower, or when annual repair costs go past 30% of its replacement value.
Use Life Cycle Cost Analysis to weigh long-term maintenance costs against replacement. It also helps show when pouring more money into repairs stops making sense.
It’s also smart to time work around natural renovation moments. Bundle projects when systems are at end-of-life, or when safety or accessibility upgrades are already on the table.
How do I justify deferred projects?
Use an evidence-based, risk-managed approach instead of reacting to repairs as they pop up. Start with a Facility Condition Index (FCI) to compare deferred maintenance costs against current replacement value.
Then use Multi-Criteria Decision Analysis (MCDA) to score items based on safety, compliance, operational impact, and deterioration. Record those results in a prioritized register so the highest-risk issues are easy to spot.
If needed, apply Value of Information (VoI) analysis to identify low-cost inspections that can support deferral without compromising safety.