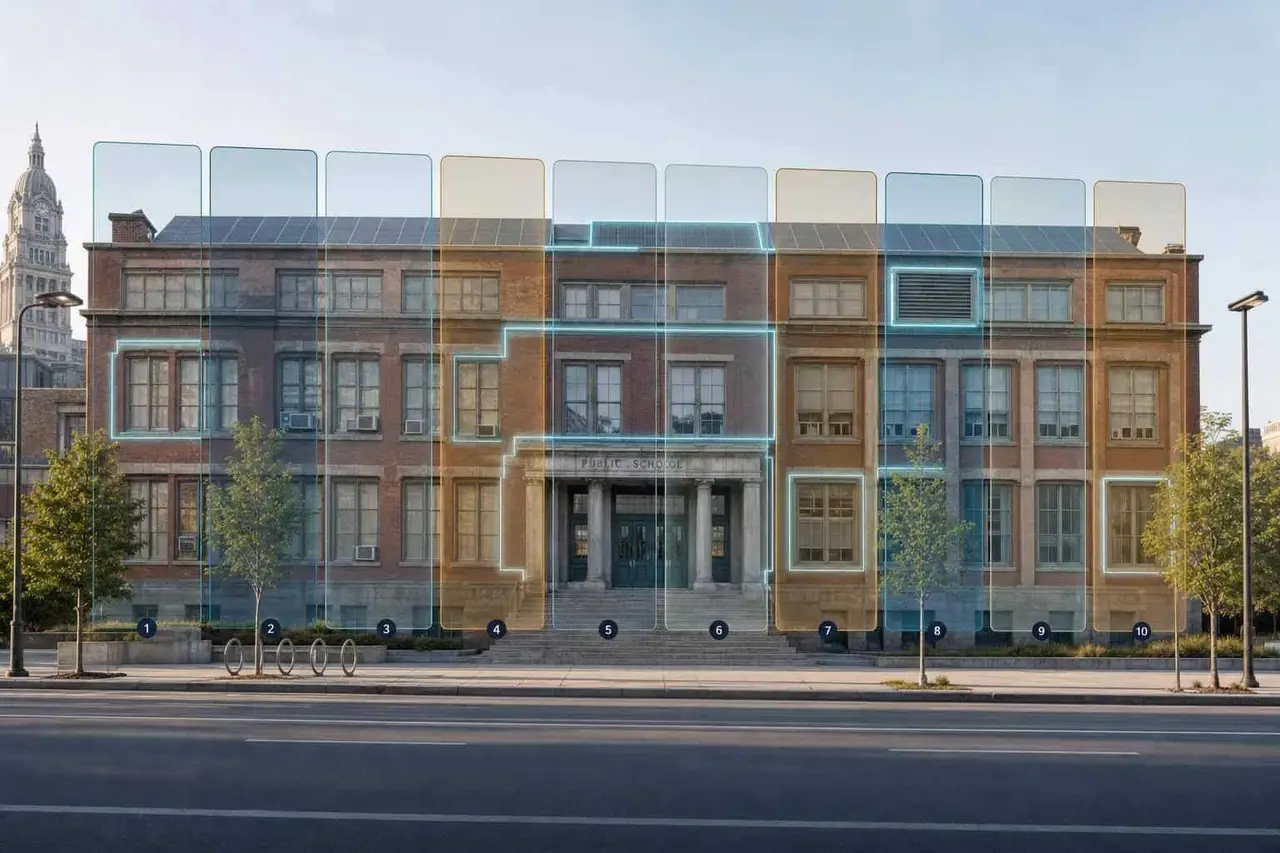
Aging Schools and Public Buildings: How to Phase Investments Over 10 Years
If I wait to fix aging buildings, I usually pay far more later. A clear 10-year plan helps me sort urgent risks, spread spending, and avoid turning a planned $120,000 replacement into a much larger emergency.
Here’s the short version:
- I start with a single asset list for each site, building, system, and part.
- I score condition, risk, code issues, and service impact the same way across the portfolio.
- I separate backlog repairs, capital renewal, and modernization so one category does not crowd out the others.
- I place work into Years 1–3, Years 4–6, and Years 7–10 based on failure risk, age, and cost.
- I bundle projects when one shutdown or one contractor visit can cover more than one job.
- I build board-ready outputs: asset register, FCI reports, ranked project list, 10-year spend forecast, funding map, and energy/carbon path.
- I update the plan each year and do a deeper reset every 3–5 years.
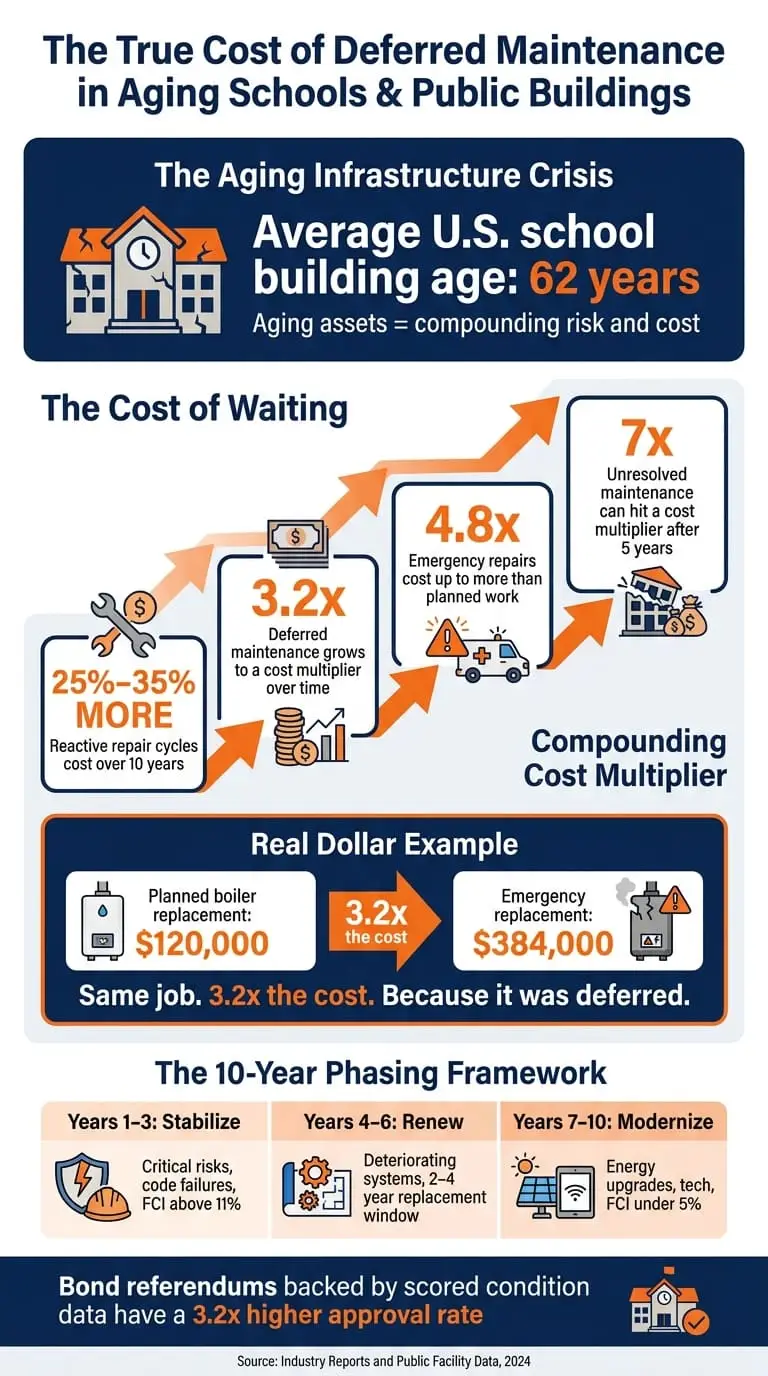
A few numbers shape the case:
- The average U.S. school building is 62 years old
- Reactive repair cycles can cost 25%–35% more over 10 years
- Deferred maintenance can grow to a 3.2x cost hit over time
- Emergency repairs can cost up to 4.8x more than planned work
- Buildings with FCI above 11% usually belong in the first phase
The core idea is simple: use asset data, risk scoring, phased timing, and regular reviews to decide what to fix now, what to schedule next, and what to group into one capital program.
This article explains that process in plain terms, without turning the roadmap into a giant wish list.
The True Cost of Deferred Maintenance in Aging Schools & Public Buildings
Framework for Prioritizing Capital Improvement Projects – Information Session (9/8)
sbb-itb-5be7949
Build the data foundation for decisions
A 10-year investment roadmap is only as strong as the data behind it. If your asset register isn’t standardized and your inspection records are all over the place, the capital plan gets hard to defend. The job here is pretty simple: gather the inputs you need to decide what to fund, when to fund it, and why. That starts with mapping every asset to the building systems that drive risk and cost.
Create an asset inventory by site, building, system, and component
Set up your portfolio in a clear hierarchy: district → campus → building → system → component. Every repair, inspection, and cost record should tie back to a specific asset at the right level. If that link is missing, things get messy fast.
For aging schools and public buildings, the systems that matter most – and that this plan will phase over time – are roofing, HVAC, electrical distribution, plumbing, fire safety, elevators, accessibility infrastructure, and building automation [2].
Simeo Inventory can pull this structure into one central asset register. That means no more scattered spreadsheets, isolated files, and overstuffed binders. Instead, you get one shared record that can feed straight into investment planning models.
Once the inventory is done, the next move is to score each asset’s condition and exposure using the same scale.
Record condition, risk, and compliance exposure in a consistent format
Every asset needs a condition score. A standard 1–10 scale – based on physical inspections, age, failure history, and field staff input – gives you a clean baseline across buildings and sites. Any asset scoring 3/10 or lower should automatically trigger a formal repair-or-replace review [2].
Condition alone doesn’t tell the whole story. You also need to log the risk factors that hit hardest in U.S. public buildings: fire code compliance gaps, ADA accessibility deficiencies, classroom disruption, and energy impact. Add field photos, failure history, and repair costs, and each capital request becomes much easier to back up [2].
Those scores then feed the lifecycle and cost baselines used to compare repair, renewal, and replacement.
Estimate lifecycle, cost, energy, and carbon baselines
For each major asset, capture the inputs that determine where it belongs on the investment timeline. Remaining useful life (RUL) and current replacement cost based on regional pricing data help place each asset in years 1–3, 4–6, or 7–10. Annual maintenance cost per $1 of replacement value (CRV), along with current energy use and carbon baseline, fills in the rest [2].
One key benchmark: annual maintenance is $2.10 per dollar of CRV [3]. Another common trigger is when annual repairs go above 30% of replacement value, which should prompt a capital replacement review [2]. To check those numbers, pull in 12–36 months of work order data, including labor, parts, contractor spend, and emergency callout costs [2].
If you’re dealing with an older portfolio, predictive maintenance without IoT can help fill in missing data and support long-range CAPEX and OPEX forecasts.
With these inputs in place, the next step is to rank projects by risk, condition, lifecycle timing, and carbon impact.
Decide what to do now, later, or together
Rank projects by risk, condition, lifecycle timing, and carbon impact.
Score projects across risk, condition, lifecycle, and carbon criteria
A weighted scoring matrix helps shift capital decisions away from opinion and toward a more objective process [3][5]. For U.S. public buildings and school districts, the criteria that usually matter most are safety and life-safety risk, compliance exposure, impact on school or community service continuity, asset condition and remaining useful life, cost efficiency, and sustainability impact.
Score each project against those criteria, apply the weights, and total the result. What you get is a ranked capital list, not just a scorecard.
| Priority | Category | Criteria | Examples |
|---|---|---|---|
| Priority A | Safety & Compliance | Active risk, code violations | Failed electrical panels, ADA violations |
| Priority B | Service Continuity | Closure risk; failure likely in 12–24 months | Leaking roofs, HVAC at end of life |
| Priority C | Significant Deterioration | Visible decline; replace in 2–4 years | Deteriorating parking, old HVAC controls |
| Priority D | Monitor | Good/fair condition; 5–10 year horizon | Recently replaced systems, newer roofs |
That ranking feeds directly into the 10-year phasing plan. Use it to decide what happens first, what can wait a bit, and what fits later in the sequence.
Separate backlog repairs, capital renewal, and modernization projects
Keep backlog repairs, planned renewal, and modernization in separate budget lines. If all three fight over the same pot of money, safety-critical backlog work usually wins, and planned renewals get pushed back. Then those renewals drift into emergency territory. That’s how a $120,000 planned boiler replacement turns into a $384,000 emergency [1].
This split also makes funding decisions cleaner. You can match each project to the right source instead of pulling everything from the general fund [5].
It also gives you a better way to test timing: what needs to move now, what can wait, and what may make sense to bundle with other work.
Compare the cost and risk of acting now versus deferring
The main goal here is simple: make the cost of waiting hard to ignore. Deferred maintenance compounds at an average 3.2x cost multiplier over time [1]. And the hit isn’t just financial. Delay can affect operations, energy use, and carbon too.
| Project Type | Act Now | Defer | Risk Change | Total Cost Effect | Service Disruption | Carbon Effect |
|---|---|---|---|---|---|---|
| Flat roof near failure | Planned replacement: $8–$22/sq ft [4] | Deferred condition can push costs to 4x with collateral damage [1] | High → Critical | Significant increase | Service disruption risk | Minimal |
| Aging HVAC at end of life | Planned replacement: $15–$40/sq ft [4] | Emergency replacement and downtime costs [1] | High → Critical | 3.2x cost multiplier [1] | Occupant comfort and continuity risk | Ongoing high energy use |
| ADA non-compliance | Remediation now | Compliance risk if deferred | Regulatory → Severe | Higher correction cost later | Access limitations | Neutral |
| Fire safety gaps | Code-compliant upgrade | Safety risk if deferred | High → Severe | Higher correction cost later | Potential service interruption | Neutral |
| Energy system upgrade | Utility savings begin immediately | Lost savings compound annually | Low → Moderate | Higher lifecycle cost | Minimal | Ongoing carbon penalty |
Once the list is ranked, place projects into years 1–3, 4–6, or 7–10. That turns a stack of needs into a schedule you can actually use.
Phase investments across 10 years
Once you’ve ranked projects, the next step is to turn that list into a 10-year schedule that fits both your budget and your construction windows. The basic idea is simple: sequence work based on the point when risk, failure, and disruption stop being acceptable.
Set phasing rules for years 1–3, 4–6, and 7–10
Each phase should have a clear job.
Years 1–3 should focus on stabilizing critical risks and code failures. That includes failed electrical panels, end-of-life HVAC, active roof leaks, ADA violations, and failed fire panels. Buildings with a Facility Condition Index (FCI) above 11% belong in this window [4].
Years 4–6 are for systems that are still running but are clearly wearing down. Aging plumbing and worn parking surfaces often land here, along with components that need replacement within 2–4 years to avoid cost growth [4].
Years 7–10 are the window for modernization, energy work, and long-range upgrades for assets that are still in good or fair condition, with FCI under 5%. Technology and security systems, which often have useful lives of 7–12 years, commonly cycle back into this phase [4].
Once the timing is set, group work that can share the same shutdown, contractor, or access window. That’s where scheduling starts to pay off.
Bundle projects to cut disruption and improve value
Bundling work helps cut mobilization, rework, and disruption. And the cost of waiting can be steep. Deferred roofing repairs can generate an average of 2.3x their original cost in secondary damage to ceiling tiles, insulation, and structural members [4]. So if you catch a roof replacement early and pair it with insulation upgrades or solar readiness work, you can cut rework and reduce mobilization costs.
| Bundling Approach | What to Combine | Primary Benefit |
|---|---|---|
| By system | HVAC + controls + ductwork | Single mobilization; better energy performance |
| By building | Roof + insulation + solar readiness | Reduces rework and schedule risk |
| By geography | All critical repairs in one wing or campus zone | Lower contractor costs; less disruption |
| By timing | Safety + modernization in one construction window | Minimizes disruption to occupants |
Use budget scenarios to test how much of the roadmap fits under each funding outlook.
Model baseline, constrained, and accelerated budget scenarios
Every plan needs budget scenarios. A constrained scenario – roughly 80% of identified need – covers only safety and code work. A baseline scenario – 100% of need – stabilizes the FCI by funding safety, code, and deteriorating systems on schedule. An accelerated scenario – around 120% of need – front-loads modernization and backlog reduction [3].
Each scenario should show:
- Annual CAPEX in USD
- Projected OPEX savings
- The resulting FCI trajectory
That gives boards and finance teams a plain view of what each funding level pays for – and what risk still remains.
Turn the plan into audit-ready deliverables and governance
Once projects are phased, the next step is turning the roadmap into the paperwork people can actually approve, fund, and defend. A 10-year roadmap only works if budget owners can read it, trust it, and stand behind it. In plain terms, it needs to become a board-ready package, not just a list of projects.
Produce the core outputs boards and finance teams expect
Start with the same asset data, risk scores, and phasing logic already used in the roadmap. Then use that information to build the package boards and finance teams expect.
That package should include:
- a current asset register
- FCI reports
- a prioritized project list
- a 10-year capital and operating spending forecast
- a funding map
- an energy and carbon trajectory
Each item should tie back to inspection data, photo evidence, and maintenance history linked to specific assets [4]. That traceability matters. It gives finance teams something solid to review, and it gives leaders something they can defend when questions come up.
There’s also a direct payoff here: bond referendums backed by scored condition data and documented deferred maintenance have a 3.2x higher approval rate [4]. That’s a strong case for keeping the evidence trail clean, complete, and easy to follow.
Set review cycles, approvals, and update rules
Then put the plan on a set review cadence so it doesn’t go stale. Treat it as a living document, with clear ownership for updates and approvals.
An annual desktop update should be the baseline. These reviews should:
- adjust cost estimates for inflation
- pull in new work order data from your CMMS
- flag projects that have moved up or down in urgency
- line up with capital budget cycles
Every 3–5 years, the roadmap should go through a deeper strategic refresh. That refresh should rebaseline the plan based on new inspections, budget changes, enrollment shifts, or updated master plans [5][7].
Some events shouldn’t wait for the next scheduled review. A major federal funding change, such as the IIJA expiration in 2026, a new state-mandated design standard, a major weather event that damages assets, or a sudden enrollment drop that changes which buildings need to stay open should all trigger an immediate update [7]. Build those triggers into governance from the start so the plan can hold up through leadership turnover and public scrutiny.
| Review Type | Frequency | Primary Purpose |
|---|---|---|
| Annual Update | Every year | Refresh cost estimates, incorporate CMMS data, flag urgency shifts, and align with capital budget cycles |
| Strategic Refresh | Every 3–5 years | Rebaseline roadmap based on new inspections, budget changes, enrollment, and master plans |
| Triggered Update | Event-driven | Respond to code changes, major funding shifts, or extreme weather events |
That cadence keeps the plan current, defensible, and ready for funding decisions.
Conclusion: What a strong 10-year roadmap should deliver
A strong 10-year roadmap turns deferred repairs into a clear, defensible plan that boards can approve and finance teams can fund.
It comes down to four moves: build a verified asset baseline, rank projects using consistent criteria, phase the work across 10 years, and publish audit-ready deliverables.
That setup matters because delay drives up both risk and cost. Deferral adds up fast: emergency repairs cost 4.8x more than planned maintenance, and unresolved maintenance can hit a 7x cost multiplier after five years [2][6].
The goal is a living, audit-ready program that cuts deferred maintenance, keeps buildings safe and operational, controls long-term costs, and lowers carbon over time.
FAQs
How do I start a 10-year plan with incomplete asset data?
Start with an inventory of your critical assets, even if a few gaps remain. Use site inspections, technician input, visible wear, repair history, and a standard condition score to flag the assets most likely to cause safety problems or surprise costs.
Then map out a phased 10-year roadmap based on risk, condition, and lifecycle estimates. Tackle the highest-risk assets first, and update the plan as better data comes in.
What should I fund first if my budget is limited?
Prioritize the systems and components that have the biggest impact on safety, building performance, and day-to-day operations.
Start with critical mechanical, electrical, and HVAC systems that are nearing the end of their service life, along with roofs, building envelopes, and other infrastructure that protects the facility. This helps keep the building safe, functional, and ready to support learning while larger projects are phased in over time.
How often should I update the investment roadmap?
Use it as part of a rolling 5–10-year capital forecast. For most school districts, that supports near-term budgeting, long-range facility planning, and phased replacements.
That makes it easier to set priorities, line up funding, and stay flexible as building conditions and district needs shift over time.
Related Blog Posts
- Aging Infrastructure in Europe: How to Prioritise Renewal Under Budget Constraints
- Climate Change Adaptation for Aging Assets: Where to Invest First
- 90 Days to Your First Asset Investment Plan: A Step-by-Step Implementation Guide
- Worst-Performing Buildings: How to Identify, Triage and Phase Investments Across a Portfolio