








If an AI system can’t show why it picked a project, you shouldn’t use it to guide spending.
I’d boil this article down to one idea: in asset management, AI recommendations need to be easy to trace, easy to review, and easy to defend. That means every plan should link each project to the asset record, the source data, the model output, the business rules, and the final approval step. When that happens, teams can build CAPEX and OPEX plans that hold up under board review, audits, and budget pressure.
Here’s the short version:
- I need local explanations for single assets: why this asset, why this action, why now
- I need portfolio explanations for the plan: why these projects, in this order, under this budget
- I need each recommendation to show the same core drivers:
- condition
- failure risk
- lifecycle cost
- service impact
- energy use
- carbon impact
- I need scenario testing to show what changes when budget, cost, or policy assumptions change
- I need human sign-off, version control, and a record trail that can be reviewed years later
The article also points to clear business outcomes. With explainable planning, teams may cut audit prep time by up to 70% and lower total cost of ownership by 25% to 30% through better-timed work. In simple terms: AI is most useful when people can check the logic, question it, and still stand behind the final decision.
A useful way to think about it is this: the model does not just rank projects. It needs to show the trade-offs between risk, cost, service, compliance, and carbon in plain English, with numbers that match how U.S. teams already work – like $600,000, 380,000 kWh/year, 38 metric tons of CO2e/year, and planning windows such as 2026–2035.
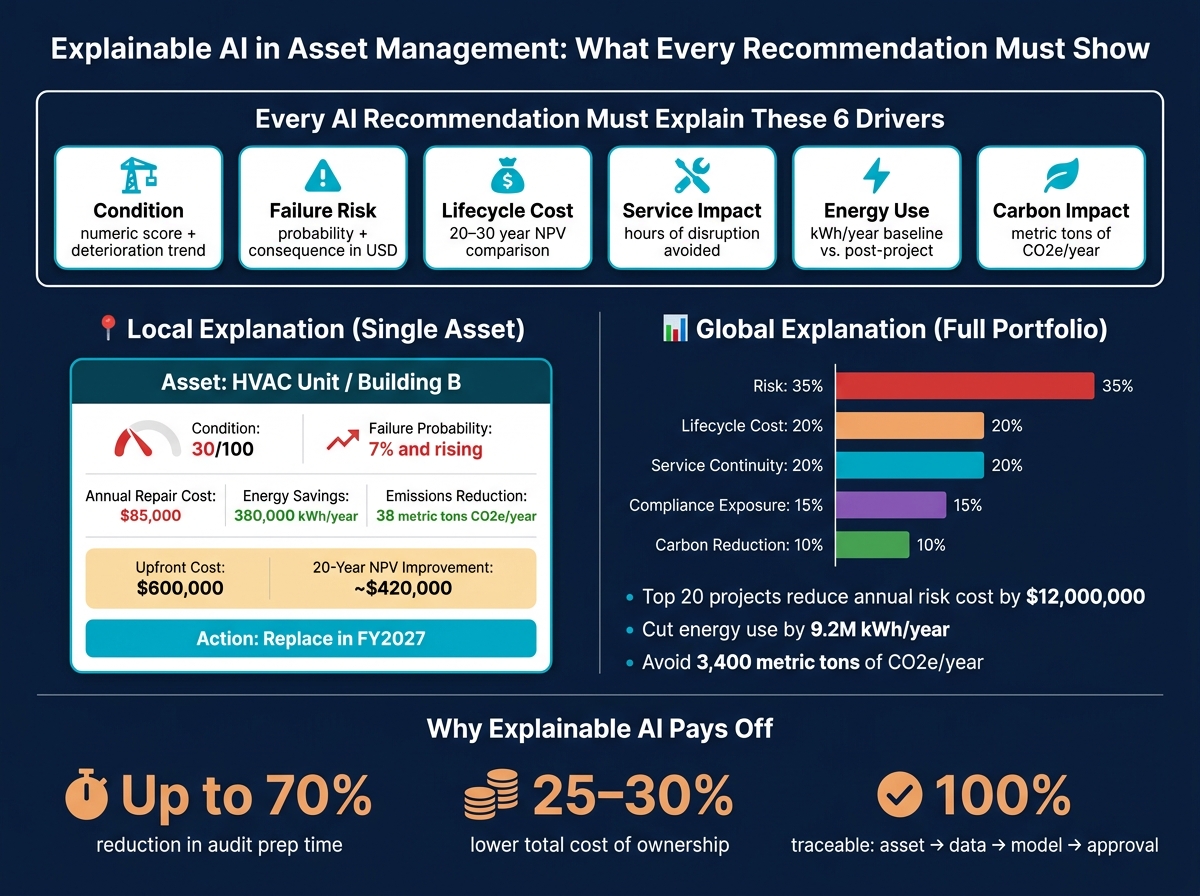
Explainable AI in Asset Management: Key Decision Drivers & Business Outcomes
Quick comparison
| What needs explaining | Main question | What I should see |
|---|---|---|
| Single asset recommendation | Why this asset and why now? | Condition score, failure trend, cost-of-delay, action timing, expected impact |
| Portfolio plan | Why these projects first? | Ranking logic, weights, budget limits, risk and carbon totals |
| Scenario change | What if assumptions change? | Project shifts, spend change, risk change, carbon change |
| Approval and audit trail | Who approved this and based on what? | Source data, model version, override reason, final decision record |
In short, this article is about turning AI from a black-box ranking tool into a planning system that people can review, question, approve, and use with confidence.
sbb-itb-5be7949
1. What Explainable AI Means for Asset Investment Decisions
1.1 What Explainable AI Means in Asset Management
Explainable AI means an investment recommendation doesn’t show up like a black box. It shows why the system made that call, using the same condition, risk, cost, and carbon evidence that asset teams already rely on.
So if a system recommends renewing Bridge A in 2027 or deferring an HVAC replacement at Building B, the logic should be clear in business and engineering terms. Bridge engineers, facility managers, and investment committees all need to see reasoning they can work with.
There are two main views here. Global explanations show how the model behaves across the portfolio. Local explanations show what drove one asset or project recommendation, such as condition score, failure probability, lifecycle cost, traffic or criticality, regulatory constraints, carbon impact, and service-level requirements.
Those two views matter for different reasons. Global explanations show the portfolio-level logic. Local explanations show the asset-level case for a single call. Global explanations help confirm that the model lines up with ISO 55001-aligned objectives and risk appetite. Local explanations help defend a specific renewal or retrofit in front of a committee or auditor.
A useful audit trail ties each recommendation back to the asset, the source data, the model, and the final action.
1.2 Which Asset Planning Decisions Need Explanation
This kind of explanation matters most when a decision affects capital, risk, or compliance. In plain terms, the decisions that need explainability most are the ones with major financial, safety, regulatory, or long-term effects. These are the calls that can lock in capital for years and may need to stand up to review long after the plan was approved.
That includes decisions like:
- project ranking
- renewal timing
- deferred maintenance
- budget allocation
- risk mitigation choices
- carbon-aligned retrofit sequencing
These decisions often sit inside multi-year CAPEX and OPEX plans, like a 10-year building retrofit roadmap or a decade-long bridge replacement program, all under budget, risk, and carbon constraints. If priorities get challenged years later, decision-makers need to rebuild the story: what was known at the time, what the model projected, and what trade-off was accepted [6][4][5].
For that review to mean anything, each recommendation also needs to show its data, logic, and approval trail.
1.3 What a Trustworthy Recommendation Looks Like
A trustworthy recommendation is accurate, traceable, and defensible. It needs four things working together:
- Traceable inputs: Inspection dates, condition ratings, traffic counts, energy use, emissions factors, and cost estimates must link back to a source system with documented data quality rules.
- Consistent scoring: Risk scores, priority scores, and cost-benefit indices should use transparent, version-controlled formulas applied the same way across the portfolio.
- Human approval: High-impact recommendations should go to a defined committee with clear approval thresholds before they enter the plan.
- Audit-ready records: The full decision trail – data used, assumptions applied, and final rationale – must be reproducible and reviewable on demand.
| Element | What It Requires |
|---|---|
| Traceable inputs | Data traced to source systems with documented quality rules |
| Consistent scoring | Transparent, version-controlled formulas applied uniformly across assets |
| Human approval | Defined approval thresholds for high-impact recommendations |
| Audit-ready records | A complete decision trail that can be reproduced and reviewed later |
2. How to Make Recommendation Drivers Visible
2.1 The Core Factors Behind Each Recommendation
Trust goes up when people can see why a model made a recommendation. Not guess. Not infer. See it.
Each recommendation should show the four drivers behind it: condition, risk, lifecycle cost, and carbon/energy impact. And those figures should appear in standard U.S. units and formatting.
Condition should be shown as a numeric score, such as 0–100 or 1–5, along with a deterioration trend line built from dated inspection records. Risk should be broken into two parts: failure probability and consequence of failure, shown in U.S. dollars, hours, or safety impact. Lifecycle cost should compare do nothing, maintain, and renew-or-replace scenarios over a 20- or 30-year horizon, with all figures in U.S. dollars and a stated discount rate. Carbon and energy figures should appear as kWh/year for energy use and metric tons of CO2e/year for emissions, with baseline and post-project values for each option.
For a bridge deck renewal, that means showing the current condition score, the projected drop over the next 5 to 7 years, the rising failure probability, and the lifecycle cost gap between acting now and waiting. Every deferral recommendation should also include cost-of-delay.[2]
Once those drivers are visible, the next job is simple: explain one recommendation in plain English.
2.2 Local Explanations for a Single Asset or Project
A local explanation looks at one asset and answers three direct questions: why this asset, why this action, and why now?
The best format is a short plain-language summary paired with a factor breakdown that shows which variables pushed the recommendation past the decision threshold. For example:
"Replace in FY2027. Condition: 30/100. Failure probability: 7% and rising. Annual repair cost: $85,000. Energy savings: 380,000 kWh/year. Emissions reduction: 38 metric tons of CO2e/year. Upfront cost: $600,000. 20-year lifecycle NPV improves by about $420,000."
That works because each metric ties straight to something the committee cares about: budget predictability, safety, or sustainability targets.
A deferred façade repair needs the same level of clarity, just pointed in the other direction. The explanation should show why waiting makes sense. If the probability of a safety-critical failure is below 1% per year, the asset’s criticality is moderate, and lifecycle cost analysis shows that bundling the façade work with a planned window and insulation upgrade in 5 years is the better move, then the explanation should say exactly that. It should also show the combined energy savings from bundling versus doing the façade work on its own. Each local explanation should link back to the asset, data, model, and action.[2]
From there, portfolio planning pulls those asset-level reasons into a ranked investment program.
2.3 Global Explanations for the Full Portfolio Plan
At the portfolio level, the question shifts: why these projects, in this order, under these constraints?
That calls for a clear scoring framework that combines multiple criteria with set weights. For example:
- Risk: 35%
- Lifecycle cost: 20%
- Service continuity: 20%
- Compliance exposure: 15%
- Carbon reduction: 10%
Those weights should not appear out of thin air. They should be tied to board policy, regulation, or decarbonization targets.
The table below shows how each factor appears in a global explanation.[2]
| Decision Factor | Purpose | How It Appears in Explanations |
|---|---|---|
| Risk | Protect public safety; avoid failures | "This project reduces expected annual failure cost by $X and addresses a high-safety-risk asset" |
| Service continuity | Maintain operations | "Avoids an estimated 120 hours of service disruption per year" |
| Compliance exposure | Meet regulatory requirements | "Eliminates $250,000/year of regulatory penalty risk" |
| Lifecycle cost | Minimize long-term spending | "Improves 30-year NPV by $3,100,000 with a 7-year payback" |
| Carbon reduction | Meet climate targets | "Reduces portfolio emissions by 12% and avoids 1,800 metric tons of CO2e/year" |
A strong global explanation should also show portfolio totals. For example, the top 20 projects might collectively reduce expected annual risk cost by $12,000,000, cut energy use by 9.2 million kWh/year, and avoid 3,400 metric tons of CO2e/year. That kind of summary lets an investment committee check the plan at a glance and see whether it is balanced across safety, cost, and sustainability – instead of skewing too far toward just one goal.
3. How to Build an Explainable Workflow in Oxand Simeo™
Making AI recommendations explainable is not just about getting better outputs. It means building a workflow where each step leaves a clear audit trail. Oxand Simeo™ links asset data, predictive models, prioritization rules, and scenario simulation in one planning flow, so every recommendation can be traced from the asset itself to the final investment call.
3.1 Start with a Trusted Asset Inventory and Data Rules
Trust begins when every recommendation points back to validated asset records and rule-based inputs. Once the drivers are set, the workflow starts by locking down asset data and rules.
Simeo Inventory brings together asset data from existing sources such as CMMS, GIS, and BIM into one structured register. Assets are arranged in a standard hierarchy: site, system, component, and sub-component. For a bridge portfolio, that could be Bridge → Deck → Expansion joint. For a real estate portfolio, it could be Building → HVAC → Air handling unit. That setup helps make sure predictive models and investment rules are applied at the right level of detail.
Each asset record includes the fields that make explainability possible: condition ratings on a 1–5 or 1–10 scale, risk fields like probability of failure, consequence of failure, and safety impact, plus lifecycle cost attributes such as replacement cost, maintenance unit rates, and service life. U.S. portfolios also record imperial measurements, like span length in feet and floor area in square feet, with all costs shown in USD.
Validation rules stop incomplete or inconsistent inputs before a record enters a model. The platform flags missing entries, like an inspection submitted without a condition rating, an asset ID, or an inspection date in MM/DD/YYYY format. It also catches logic issues, such as a "poor" condition rating paired with an unrealistically low failure probability. The Simeo GO mobile app helps field teams with guided inspections that work offline and sync to the cloud later, which cuts down on data gaps at the source.
3.2 Connect Predictive Models to Readable Planning Logic
Once the asset inventory is trusted, the next step is linking it to models that show why an intervention is needed and when. The model needs to make the condition, risk, lifecycle cost, and carbon factors behind each recommendation easy to follow.
Simeo uses validated degradation and energy-use rules to project how each asset’s condition, risk, and cost change over time. Say you have a steel bridge in a coastal area. It may shift from "good" to "fair" over 10 years. The same bridge type in a dry inland climate may hold that rating longer. Intervention rules then spell out how certain actions change those paths. For example, a rule might state that repainting steel elements in year 12 adds 10 years of remaining service life and cuts the probability of corrosion-related failure by a set percentage.
Each recommended action comes from a library of 30,000+ maintenance and renewal actions, with cost, risk reduction, and carbon impact attached to each one [1]. When Simeo makes a recommendation – say, a bridge renewal in 2028 – it stores the full decision path: the forecasted condition trend, the risk threshold that triggered the flag, the intervention rule used, and the lifecycle cost comparison that supported the selected year. That means planners, auditors, and board members can trace a project’s ranking back to plain, documented inputs instead of treating the result like a black box.
Once the model logic is visible, scenario testing shows what changes when the constraints change.
3.3 Use Scenarios and Counterfactuals to Explain Trade-offs
A single recommended plan usually isn’t enough. Decision-makers need to see how the plan shifts when the assumptions shift. That’s where scenario simulation and counterfactuals come in.
Simeo lets users run the same portfolio under more than one scenario. A baseline scenario might show unconstrained spending over 10 years, totaling $22,000,000 from 2026 to 2035. A budget-constrained scenario might cap capital expenditures at $15,000,000 over five years (2026–2030). That forces the engine to defer lower-priority projects, protect safety-critical ones, and put more attention on retrofits with the highest carbon reduction per dollar spent.
In that case, a bridge renewal might move from 2027 to 2030. The spend goes down, but residual risk stays higher during those three years. The platform shows exactly why: condition keeps getting worse, but risk stays under the defined threshold and total spending stays within the cap.
Counterfactual explanations go a step further.
"what happens if we increase the budget from $15,000,000 to $18,000,000?"
When that question comes up, the platform recomputes the plan and shows which projects move forward, how risk changes, and what the budget trade-off costs in quantified risk reduction over the years that follow [1].
Those scenario outputs then feed into the validation, approval, and documentation steps in the next section.
4. How to Validate, Govern, and Document Recommendations for Audit
Explainability means very little if no one tests the model, no one knows who signs off, and the records fall apart the moment an auditor asks for them.
4.1 Validate Model Outputs with Backtesting and Stress Tests
After scenario analysis, check whether the recommendations stand up against past results and harsh conditions.
Use backtesting, stress testing, and sensitivity analysis to pressure-test the model from a few angles. Backtesting compares past model recommendations with actual outcomes. That includes which assets declined the fastest, which repairs helped avoid emergency failures, and where the model got it wrong. Oxand Simeo™ supports this through model calibration and usage signals, comparing AI predictions against realized asset performance over time [3].
Stress testing checks whether rankings and risk-reduction curves stay steady under bad conditions, such as a sudden 20% budget cut, a 30% jump in construction costs, or a new federal resilience standard. Sensitivity analysis checks whether outputs move the way they should when inputs change. For example, if improving a building’s condition score from "poor" to "fair" doesn’t lower its urgency ranking, something in the model logic needs a closer look.
Put accuracy, stability, bias, and explanation consistency into a dashboard that committees and auditors can review. Update it at least once a year, and attach it to board and committee packs.
Once the outputs clear validation, the next step is simple: decide who can approve them, who can override them, and who signs the final decision.
4.2 Define Human Approval Points and Committee Roles
Use the validation results as the starting point for approval and override decisions.
A three-lines-of-defense model works well here:
- Asset managers own project-level recommendations.
- Risk and compliance review methodology and policy alignment.
- Investment committees approve major capital decisions.
The table below shows how those roles usually split across common decision types:
| Decision Type | AI Role | Owner | Approver | Required Documentation |
|---|---|---|---|---|
| Model parameter changes | Provides sensitivity outputs | Asset analytics lead | Chief asset officer | Change log, validation summary, updated model card |
| Annual capital plan | Generates ranked portfolio | Asset managers | Investment committee | Scenario reports, bias check, policy alignment review |
| Project-level AI override | Flags original recommendation | Asset manager proposes change | Regional director or designated approver | Override rationale, supporting evidence, risk and carbon impact |
Require human approval before model changes, version releases, and projects above defined USD thresholds.
4.3 Build Documentation That Supports Audits and Board Review
Once approval roles are in place, document each decision in a way that stands up to audit and board review.
Generate documentation on a continuous basis from the live planning model. Oxand Simeo™ automatically produces an audit trail, storing each recommendation with its source data, model version, and final action [2]. Organizations using this approach have reduced audit preparation time by up to 70% [1][2].
The documentation set should cover three levels. At the model level, keep a model inventory that explains each model’s purpose, data sources, key assumptions, and known limits. Keep a version history with release dates and validation results. Add model cards that summarize performance metrics.
At the data level, document data dictionaries, quality rules, source systems such as CMMS, GIS, and BIM, plus units like square feet, miles, °F, and USD. Also track data lineage from raw input to the planning dataset used by the model.
At the recommendation level, keep explanation artifacts for major decisions. That can include factor-importance charts, scenario comparison reports, and plain-English summaries that board members can read without having to decode model jargon.
Log every override with the original recommendation, the change, the reason for it, and the expected effect on risk and carbon.
Retention schedules should line up with U.S. financial audit requirements, which are typically 7–10 years [2]. Pair that with role-based access controls and consistent naming rules, so any record can be pulled fast during a regulatory inquiry or board review.
5. Turning Explainable AI into Trusted Investment Plans
With validation, approval, and documentation in place, the last step is simple in theory and hard in practice: turning explainable outputs into decisions leaders can fund and defend. This is where explainable AI stops being model output and becomes a board-ready, audit-ready investment plan.
5.1 Key Takeaways for Infrastructure and Real Estate Portfolios
For U.S. infrastructure and real estate owners, the payoff is pretty direct: clearer project priorities, more defensible CAPEX and OPEX plans, lower operating risk, and plans that hold up against carbon targets. Explainability is the difference between a ranked list that sits in a dashboard and a funded plan that executives will actually back.
A few principles pull this together.
First, explanations need to work at two levels: portfolio and asset. The portfolio view answers why these projects now. The asset view answers why this bridge, building, or system. When both views stay easy to access, executives get the short version they need, while engineers and auditors can dig into the evidence behind each line item.
Second, each recommendation needs to show the same drivers in the same format. That consistency matters. Every recommendation should lay out its main drivers in plain business terms:
- condition
- failure probability
- lifecycle cost
- service impact
- energy use
- carbon impact
When those factors appear side by side – for bridge renewals, building retrofits, and maintenance deferrals – investment committees can compare options on equal footing. And that changes the conversation. Instead of arguing over whose project sounds most urgent, teams can review the same evidence across the board.
Scenario comparisons help here too. A risk-first plan, a carbon-aligned plan, and a budget-constrained plan each show a different path. Put next to each other, those scenarios make trade-offs plain. That kind of visibility builds committee trust and helps move approvals forward instead of letting them stall.
Governance and documentation are what make all of this usable in real decision processes. A complete audit trail should link every recommended investment back to the asset, condition data, model, and action. That is the bar for investment planning that can stand up to board review, audit review, and public scrutiny.
Explainable AI turns AI from a scoring engine into a transparent planning system for governance, budgeting, and long-term stewardship.
FAQs
How is explainable AI different from a black-box ranking tool?
A black-box ranking tool spits out results without showing how it got there. Explainable AI does the opposite. It creates an audit trail that links each recommendation to the evidence behind it.
That means you can see which factors shaped the investment plan, including risk profiles, lifecycle costs, carbon impact, and condition data. As a result, asset owners, auditors, and investment committees can check the logic, validate the recommendation, and trust what they’re seeing.
What data do we need to make AI investment recommendations explainable?
You need clean, centralized data in one unified foundation. That means pulling together internal asset records like installation dates, maintenance logs, failure histories, and condition assessments, along with external inputs such as climate volatility, regulatory requirements, market trends, and seismic activity.
You also need standardized health and criticality scores, plus operating constraints like budget caps, lease dates, shutdown windows, and carbon or energy performance metrics.
How can we prove an AI recommendation is audit-ready?
An AI recommendation is audit-ready when every decision leaves a clear, evidence-based trail. Put simply, someone should be able to trace the recommendation back to the data, rules, and records that shaped it.
That starts with centralized, standardized asset registers backed by high-quality data and complete records. If the source data is scattered, inconsistent, or missing key details, the output gets shaky fast.
It also helps to have the right control points in place:
- ISO 55000 checklists to keep reviews aligned
- Audit trails from investment plans so decisions can be traced step by step
- Governance for data ownership, validation, and versioning to show who manages the data, how it’s checked, and what changed over time
Together, these make recommendations more transparent, repeatable, controlled, and defensible to auditors, investment committees, and stakeholders.