


Less EU reporting does not mean less investor pressure. Even after the Omnibus changes, lenders and buyers still want proof they can check, not ESG claims in a slide deck.
If I had to boil the article down to the main point, it’s this: I need asset-level data, a clean audit trail, and scenario-based financial proof before any sustainability claim can support a capital decision. That means linking condition, energy, carbon, risk, and cost data to each asset and then turning that into a board-ready case.
Here’s the whole playbook in plain English:
- Start with scope and ownership
- Build the data base first
- Set up a central asset register
- Track age, condition, criticality, replacement cost, and inspection history
- Link assets to energy use and Scope 1/2 emissions
- Make every claim traceable
- Show the baseline, method, assumptions, and approvals
- Keep source files, version history, and data owners in one place
- Test projects with scenarios
- Compare renew, maintain, defer, and decarbonize paths
- Measure both money and risk: ROI, NPV, IRR, payback, TCO, Climate VaR, carbon path, and failure risk
- Turn single cases into portfolio planning
- Use one evidence standard across projects
- Build 5- to 30-year plans for boards and lenders
- Standardize outputs like investment memos, dashboards, and approvals logs
A few numbers make the case clear:
- The revised CSRD scope may drop to about 20% of the companies first expected to report
- Templates may shrink by about 70%
- 76% of institutional investors still rank ESG metrics high in acquisition decisions
- Weak reporting can lead to 10%–15% valuation penalties
- Poor documentation can lead to 15%–20% pricing discounts tied to uncertainty
- Manual ESG tracking often takes 15–20 hours per week
- Audit prep time can fall by up to 70% with logged changes and better controls
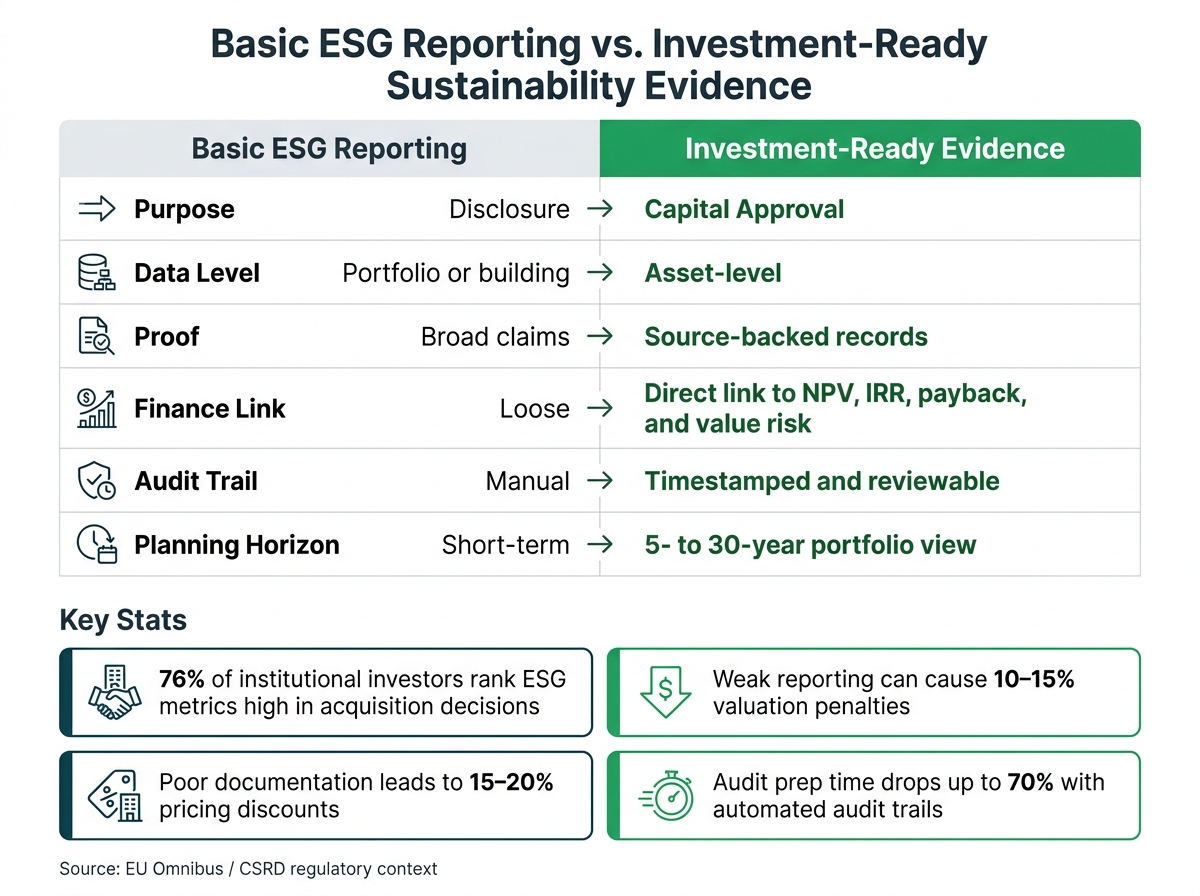
Basic ESG Reporting vs. Investment-Ready Sustainability Evidence
Quick comparison
| Area | Basic ESG reporting | Investment-ready evidence |
|---|---|---|
| Purpose | Disclosure | Capital approval |
| Data level | Portfolio or building | Asset-level |
| Proof | Broad claims | Source-backed records |
| Finance link | Loose | Direct link to NPV, IRR, payback, and value risk |
| Audit trail | Manual | Timestamped and reviewable |
| Planning horizon | Short-term | 5- to 30-year portfolio view |
Put simply: the goal is not more reporting. It’s a repeatable evidence process that helps me defend spending decisions on aging assets.
sbb-itb-5be7949
1. Build the minimum data foundation before making any sustainability claim
Before any sustainability claim goes to a lender or the board, the data has to be complete, traceable, and under control. If that sounds basic, it is. But a lot of teams still run ESG tracking in spreadsheets, and that usually turns into a weekly grind. Organizations using manual spreadsheet-based ESG tracking typically spend 15–20 hours per week on documentation and version control alone [3]. Then audit time shows up, and there’s not much to point to.
Create a centralized asset register with condition and criticality data
Start with a structured asset register. Not a flat file. A hierarchy: site, building, system, asset. That setup gives you a clean way to see what you own and where it sits.
Each asset record should include the same core fields:
- asset age
- component type
- location
- function
- replacement value
- condition score
- criticality rating
- date of the last inspection [4]
Why does this matter? Because CAPEX decisions don’t happen in a vacuum. You need to know which assets are wearing out, which ones can disrupt operations, and what repair or replacement will cost. Without that structure, renewal planning gets messy fast, and it becomes much harder to back up a funding request.
Establish risk, energy, and carbon baselines
Once the register is in place, connect it to day-to-day operating data. That includes failure risk, safety impact, service disruption, energy use, and Scope 1 and Scope 2 emissions. The key point: tie this data to specific assets, not just to the building or the full portfolio [2][3].
A baseline also needs to show direction, not just a snapshot. The issue isn’t only where an asset stands today. It’s what happens if you leave it alone. How fast will it decline? What costs follow?
When high-energy systems like chillers, boilers, and air handling units are linked to both work orders and energy trends, decision-makers can see the chain clearly: physical condition, operating strain, and financial exposure.
Document data quality and governance from day one
If the goal is to hold up under audit or investment review, the data needs guardrails from the start. That means source records, version control, validation rules, named owners, and a clear way to handle estimates.
Automated audit trails help a lot here. When every change to an asset record is logged with a timestamp and user identity, audit preparation time can drop by up to 70% [4].
Here’s what that difference looks like in practice:
| Data Category | Minimal Compliance-Only Data | Investment-Ready Data Foundation |
|---|---|---|
| Asset Register | Flat spreadsheet | Hierarchical (Site > Building > System > Asset) with unique IDs |
| Condition Depth | Qualitative notes or "good/fair/poor" | Standardized scores, failure modes, and criticality tags |
| Risk Metrics | Reactive; based on failure events | Predictive; based on criticality and deterioration models |
| Energy/Carbon Data | Annual utility bill aggregates | Asset-linked meter hierarchies and intensity metrics |
| Governance Controls | Shared files with no version control | Automated audit trails, named data owners, and validation rules |
Teams that put formal asset governance in place along these lines see a 12–18% reduction in OPEX compared with unstructured approaches [3]. That’s the point where a sustainability claim stops being a loose statement and starts looking like something you can prove.
2. Turn sustainability objectives into an auditable evidence pack for each investment case
Once the asset register, baselines, and governance controls are set, the next job is to turn that material into a case people can act on. Each sustainability objective should become an evidence pack that a lender, board, or compliance officer can check line by line.
Map each claim to the proof it requires
Every sustainability claim needs a clear paper trail behind it. If the claim is “this chiller replacement cuts Scope 1 and Scope 2 emissions by 35%,” the pack needs to show the baseline, method, assumptions, and sign-off [4][5].
ESG teams are shifting from area-based estimates to asset-level attribution. In plain terms, they’re tying energy use and emissions to specific assets, work orders, and sub-meters [5]. That makes the case easier to verify and easier to underwrite.
Include the six core components decision-makers expect
A complete pack should include:
- Condition and inspection records
- Risk and criticality scoring
- Energy and carbon baselines
- Scenario comparisons
- Cost-benefit analysis [4][5]
Finance needs the same depth of proof as engineering. It’s not enough to show kWh savings and metric tons of CO2e reduced. Finance teams also need NPV, IRR, and payback period in the same pack [1]. If that link isn’t there, even a sound technical case can get stuck at budget approval.
That’s the minimum set most decision-makers expect before they start comparing options.
Once the evidence is in place, test it against renewal, decarbonization, and budget scenarios.
Make the pack audit-ready, not just presentation-ready
A polished slide deck may look good, but it’s not the same thing as an evidence pack. Audit-ready means the pack stores source dates, modeling assumptions, scenario definitions, and sign-off records inside the file set itself [4][5]. That’s the big difference: a narrative case tells the story, while an auditable pack shows where every number came from.
Organizations that use automated audit trails and investment planning tools can cut audit prep time by up to 70% [4].
3. Use scenario planning to justify CAPEX under risk, carbon, and budget constraints
Use scenario planning to test which CAPEX path gives you the best balance of risk, carbon, and budget. The goal here is simple: compare each path against the outcomes that matter most.
Model renewal, maintenance, and decarbonization trajectories together
Separate spreadsheets make it hard to see the full picture. When replacement timing sits in one file, emissions in another, and cost data somewhere else, deferred replacement can look cheaper than it is.
Using the same condition, energy, and carbon baselines from the evidence pack, Oxand Simeo™ puts energy and carbon metrics right inside multi-year CAPEX and OPEX planning. It models asset deterioration, maintenance timing, and decarbonization pathways together to optimize CO₂ reduction per dollar invested [7].
It also helps to split CAPEX into clear buckets so capital doesn’t get assigned to the wrong job:
- Lifecycle CAPEX
- Regulatory CAPEX
- Strategic transition CAPEX
That separation matters. You should model lifecycle, regulatory, and strategic transition CAPEX separately to avoid misallocating capital [1]. Once those trajectories sit side by side, you can compare them on a like-for-like basis.
Compare scenarios using financial and non-financial decision criteria
Different people in the room care about different things. Finance teams may focus on return and cost. Operations teams may care more about reliability and failure risk. Scenario comparisons need to cover both.
Think of these criteria as the decision layer that turns evidence into approval.
Track ROI, total cost of ownership (TCO), and Climate Value-at-Risk (Climate VaR) – value at risk from transition and physical shocks [6]. Also track the asset’s stranding year against CRREM carbon pathways, CO₂ intensity reduction, energy demand savings in kWh, and asset failure risk [8] [6].
It also makes sense to test the assumptions that can swing the numbers the most. In most cases, that means:
- Energy prices
- Discount rates
- Timing of asset failure
That sensitivity analysis shows whether a scenario still holds up when the inputs move.
A hypothetical portfolio example
A portfolio example shows how this kind of comparison can change the funding call. In a 66-building portfolio, sequencing upgrades and electrifying heat cut the backlog 27%, saved €4 million, and reduced Climate VaR from €50 million to €24 million [6] [8].
That kind of proof is what boards and lenders can fund.
4. Link project evidence to ISO 55001-aligned portfolio planning and governance
Once you pick your scenarios, the next step is to lock them into ISO 55001-style governance. That way, the portfolio keeps working from the same evidence standard instead of drifting into one-off decision-making.
ISO 55001 gives you a framework that links asset management policies, lifecycle processes, and measurable KPIs. It also lines up with the same data controls used for reporting and investment review [3]. In plain terms, your asset management policy should spell out how ESG impacts are assessed, how often they’re reviewed, and how they feed into capital decisions. A yearly review is a good place to make that explicit.
From there, each investment case can point back to the same policy, the same risk-based prioritization rules, and the same data base used for maintenance planning. That keeps every project tied to one set of rules, one set of asset records, and one reporting format. At the portfolio level, that kind of governance helps keep capital priorities aligned across sites.
Scale from single projects to 5- to 30-year portfolio plans
Boards and lenders aren’t only looking for confidence in a single project. They want to see where CAPEX spikes may hit, where maintenance has been pushed back, and how emissions may change across the full portfolio over time.
One well-documented asset case is the starting point. But by itself, it’s not enough. You need a system that can stack those cases into a clear multi-year view.
Oxand Simeo™ helps teams compare portfolio scenarios across 5- to 30-year horizons under different budget, risk, and carbon constraints. It brings cost, risk, and decarbonization priorities into one auditable plan [8]. A continuous portfolio model also keeps assumptions aligned, which can reduce ambiguity during underwriting.
Standardize board and lender reporting outputs
Good data alone won’t carry the message. The outputs matter too.
Your standard deliverables should include:
- an investment memo
- scenario dashboards
- an approvals log
Together, these give boards and lenders a plain-language narrative, a side-by-side view of options, and a record of what was approved and when.
Oxand Simeo™ generates audit-ready reports from the same models used for planning and exports standard board and lender packs from that same model [8].
This is why portfolio governance beats one-off approvals.
| Feature | One-Off Project Approvals | ISO 55001-Aligned Portfolio Planning |
|---|---|---|
| Time Horizon | Short-term (1–3 years) | Long-term (5–30 years) |
| Traceability | Manual, spreadsheet-based | Automated, timestamped audit trails |
| Interdependency Management | Often ignored; siloed decisions | Managed; accounts for cross-asset trade-offs |
| Reporting Readiness | Manual, high-effort compilation | Audit-ready, one-click export |
Conclusion: A step-by-step roadmap to build investment-ready sustainability evidence
The path from fragmented sustainability data to an audit-ready evidence pack can take weeks, not years.
Start by confirming CSRD/CSDDD scope. Then assign clear owners across Finance, Risk, ESG, Compliance, and IT. After that, move in order: data foundation, scenario modeling, evidence standardization, and then portfolio scaling.
A smart way to do this is to pilot the workflow on one portfolio first. Once it works, roll it out across the asset base. Use the same workflow for every investment case so each pack follows one standard.
| Phase | Objective | Key action | Owner |
|---|---|---|---|
| 1. Governance and scope | Define reporting scope and roles | Confirm CSRD/CSDDD scope; assign named owners | ESG, Compliance, IT |
| 2. Data foundation | Build auditable asset register | Create clean asset data and baselines | Facility and Asset Managers |
| 3. Scenario modeling | Justify CAPEX trajectories | Model renewal, maintenance, and decarbonization scenarios | Portfolio Managers, Finance |
| 4. Evidence standardization | Create audit-ready packs | Map claims to proof; standardize board and lender outputs | Compliance and QA Teams |
| 5. Portfolio scaling | Integrate into annual planning | Scale to 5- to 30-year portfolio plans | Executive Leadership, Finance |
Repeatable asset planning turns sustainability evidence into a standing, board-ready capital process. Put simply, the aim is not more reporting. It’s a repeatable, board-ready evidence process.
FAQs
What counts as investment-ready sustainability evidence?
Investment-ready sustainability evidence means centralized, standardized, audit-ready data that helps owners make the case for decarbonization and renewal spending to lenders and boards.
Put simply: it gives decision-makers one trusted set of facts to work from.
That usually means a unified asset register that brings together physical condition, energy performance, and climate risk data in one place. It also includes baseline emissions, lifecycle cost and net present value analysis, energy efficiency ratings, maintenance history, material specifications, and verified manufacturer data such as Environmental Product Declarations.
Without that kind of setup, investment cases can get messy fast. Teams end up pulling numbers from different systems, chasing missing records, and trying to explain gaps under pressure. A clean, audit-ready evidence base makes those conversations a lot easier.
What should be in an evidence pack for CAPEX approval?
An investment-ready CAPEX evidence pack should pull physical and financial data into one audit-ready repository. The goal is simple: give lenders and board members a clear, documented view of what exists, what shape it’s in, what it may cost, and where the risks sit.
Include:
- asset inventory, condition, replacement values
- energy use, HVAC efficiency, CO₂ intensity
- risk mapping, Facility Condition Index, compliance gaps
It should also cover lifecycle cost analysis, multi-year renewal scenarios, and cost-benefit comparisons so decision-makers can weigh short-term spend against long-term impact. And it should show alignment with ISO 55001, which helps back up lender confidence and smooth the path to board approval.
How can asset-level data improve board and lender confidence?
Asset-level data gives boards and lenders more confidence because it turns sustainability claims into verified, decision-grade evidence.
When owners bring data like condition scores, energy performance ratings, and climate risk models into one place, they move away from guesswork. What replaces it is standardized, audit-ready information that people can actually use.
For boards, that means a clearer case for capital allocation. It also makes it easier to track decarbonization progress and line up investments with long-term financial goals.
For lenders, clear and traceable documentation can lower transition risk. It also helps support green funding and regulatory compliance.