


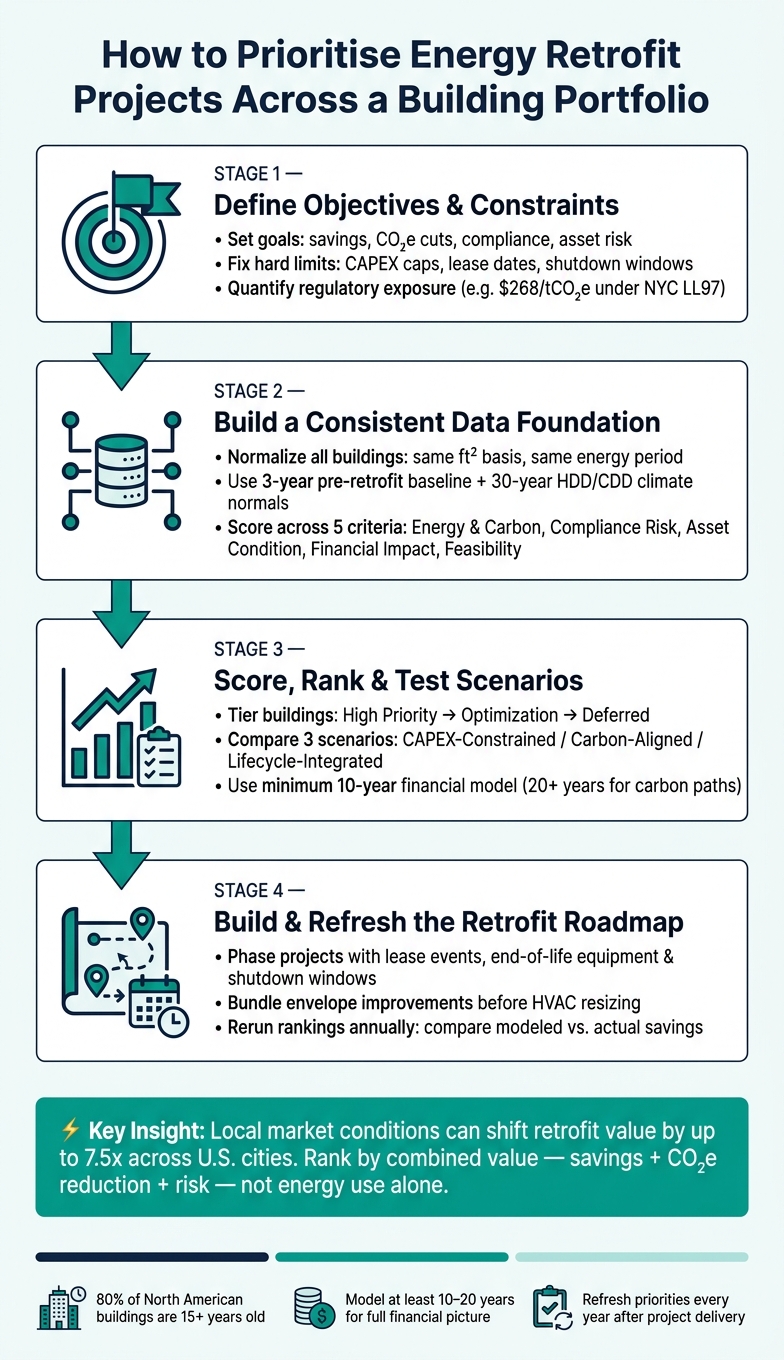
If I have to choose where to spend retrofit dollars first, I should rank buildings by cost, carbon, compliance risk, and timing – not energy use alone.
Across a portfolio, two buildings with similar energy use can deserve very different treatment. One may face near-term fines, another may have old HVAC nearing end of life, and another may be hard to work on because of tenant schedules. A simple ranking based only on EUI misses that. That matters even more when about 80% of North American buildings are more than 15 years old and capital is limited.
Here’s the short version of the process I’d use:
- Set goals first: decide how much weight to give to savings, CO₂e cuts, fines, and asset risk
- Set limits early: budget, lease dates, shutdown windows, and local rules like $268 per ton of CO₂e above limits under New York City’s LL97
- Use one data standard: same square footage basis, same energy period, same weather-normalized view
- Score buildings before projects: rank sites first, then test retrofit packages inside the top group
- Compare at least 3 paths: a low-budget plan, a carbon-focused plan, and a plan tied to equipment replacement cycles
- Phase work over years: line projects up with end-of-life equipment and low-disruption windows
- Update every year: compare modeled vs. actual savings, then rerun the rankings
A few points from the article stand out. First, local market conditions can change retrofit value by as much as 7.5x from one U.S. city to another. Second, a 10-year financial model is the minimum, while 20+ years often gives a better view of lower-carbon paths. Third, it helps to bundle work in the right order: reduce loads first, then size HVAC to the new demand.
Quick comparison
| Area | What I’d look at | Why it changes priority |
|---|---|---|
| Energy & carbon | EUI, fuel mix, CO₂e intensity | Shows which sites are heavy users or still tied to fossil fuels |
| Compliance | Fines, BPS deadlines, emissions limits | Turns legal exposure into a dollar number |
| Asset age | HVAC age, failures, end-of-life dates | Lets me pair retrofit work with planned replacement |
| Financials | NPV, payback, $/tCO₂e avoided | Helps compare projects on the same basis |
| Site timing | Lease breaks, vacancy, shutdown windows | Tells me what can move now vs. later |
So the core idea is simple: I shouldn’t ask, “Which building uses the most energy?” I should ask, “Which project gives the best mix of savings, CO₂e cuts, and risk reduction within my limits?”
How to Prioritise Energy Retrofit Projects Across a Building Portfolio
Free Tools to Predict and Prioritize Your Biggest Energy Savings
sbb-itb-5be7949
1. Define objectives, constraints, and decision rules
Set objectives, constraints, and decision rules before you score any building. Skip that step, and your rankings will lean toward whichever priority gets the most attention in the room, not the portfolio’s actual goals.
Set portfolio goals across finance, energy, carbon, and risk
Most portfolios are trying to balance four things at once: financial performance, energy, carbon, and risk. On the ground, that usually means weighing utility cost savings and NPV, lower energy use, annual CO₂e reductions, and risks like compliance exposure or asset value loss tied to weak energy and carbon performance [1].
A smart place to start is a "business as usual" (BAU) baseline. In plain English, that means asking: what happens financially and operationally if you do nothing? That shift matters. It turns decarbonization into an incremental investment choice instead of treating it like a pure expense. It also makes the cost of inaction a lot harder for leadership to ignore [5].
Those goals then become the lens for the constraints that come next.
Define budget, compliance, and occupancy constraints
After the goals are clear, set the hard limits. These usually include annual and multi-year CAPEX caps, regulatory deadlines, and the capital already earmarked for equipment that’s nearing end of life.
In New York City, for example, Local Law 97 charges $268 per ton of CO₂e above a building’s emissions limit [2]. That penalty should sit inside the ranking model, not buried in the footnotes.
Timing matters too. Disruptive work needs to line up with vacancy windows, lease breaks, shutdowns, and incentive deadlines. If those limits are real in practice, they need to show up in the score.
Agree on governance and scoring ownership
Scoring works better when ownership is clear across three groups: asset management, engineering or facilities, and sustainability [4].
Set the refresh process upfront, and write down the assumptions behind each scoring cycle. That includes utility escalation assumptions and how data gaps were handled. Those rules will shape the data fields and scoring criteria in the next step.
2. Build the data foundation and select scoring criteria
With your goals and limits in place, the next step is simple in theory and messy in practice: make sure you’re comparing buildings on the same basis. If one site has clean utility data and another has gaps, or one building uses gross square footage while another uses rentable square footage, your rankings can go sideways fast.
That means you need data collected in a consistent format and expressed the same way across the portfolio.
Collect consistent building, asset, energy, and risk data
At a minimum, each building should have data in five areas:
- Building profile: location, size in ft², typology, vintage, occupancy profile, ownership status
- Energy use: electricity and fuel consumption by type, annual energy cost, Energy Use Intensity (EUI) in kBtu/ft²·year
- Asset condition: major system age, maintenance history, end-of-life dates
- Financial inputs: local utility rates, discount rates, labor rates
- Regulatory inputs: applicable compliance benchmarks and deadlines for each site
Use a 3-year pre-retrofit energy and weather baseline, and normalize building comparisons with 30-year HDD/CDD climate normals when you’re comparing sites in different geographies [2][3].
That climate step matters more than people sometimes think. A building in Boston and a building in Phoenix can both look inefficient on paper for very different reasons. Normalizing the baseline helps you compare performance more fairly instead of punishing a site for its weather.
If complete data isn’t available for every building, a tiered approach keeps the work moving. Buildings with detailed audit data can move into capital-heavy project modeling first. Sites with only high-level inputs – size, location, and typology – can stay in lighter screening until better data is available.
Once the data is normalized, you can use it to score buildings and compare retrofit measures on equal footing.
Choose practical criteria to score buildings and retrofit measures
The criteria that tend to help most in actual decision-making fall into five groups:
| Criteria Category | Key Metrics | Why It Matters |
|---|---|---|
| Energy and Carbon Performance | EUI (kBtu/ft²·year), fossil fuel reliance, CO₂e intensity | Identifies the worst-performing buildings for immediate action |
| Regulatory Risk | Compliance trajectory, potential fines, BPS deadlines | Converts non-compliance into a quantified dollar exposure |
| Asset Condition & End-of-Life | Equipment age, maintenance history, end-of-life dates, BAU replacement schedule | Flags buildings where retrofit can replace a scheduled spend |
| Financial Impact | NPV, simple payback, cost per metric ton of CO₂e avoided | Justifies capital requests to investment committees |
| Feasibility and Operational Impact | Electrification readiness, disruption tolerance, operational criticality | Separates high-impact, doable projects from technical nightmares |
These criteria work because they keep the conversation grounded. You’re not looking only at energy savings in isolation. You’re also asking: Is this building at risk of fines? Is major equipment already near end of life? Can the site handle the work without serious disruption?
Common retrofit categories that move through this scoring process include HVAC upgrades, building envelope improvements, LED lighting retrofits, and building controls and energy management systems. Each one should be judged against the full set of criteria above, not just projected energy reduction.
Weight criteria to reflect portfolio priorities
The weights should match what the portfolio is actually trying to optimize for.
If you’re under heavy regulatory pressure, give more weight to energy and carbon performance and compliance risk. If the portfolio includes sites where downtime is costly, then feasibility and operational impact should carry more weight because service disruption can create real business risk. Other factors – hold/sell timing, flagship status, and tenant retention – may also deserve added weight when they shape capital decisions.
The key is consistency. Document the weights, get them approved by the right stakeholders, and apply them the same way across every building. That’s what turns scoring from a one-off judgment call into a repeatable framework that people can defend. Those weights then feed the scoring model in the next step, where buildings and retrofit packages are ranked across the portfolio.
3. Score, rank, and test scenarios across the portfolio
Apply your weighted criteria to each building first. Then test retrofit packages at the sites that rise to the top.
Score buildings first, then rank retrofit packages within priority sites
Once your criteria and weights are locked in, use them to sort buildings, then figure out which retrofit packages make sense for each priority site.
- Normalize each criterion to a common scale, like 1 to 5 or 0 to 100, using portfolio peers, benchmarks, or target levels. If a building is already close to future Building Performance Standards targets, it should score low on regulatory risk.
- Apply your weights to each normalized score and combine them into one composite score for each building.
- Group buildings into three tiers based on composite scores and readiness:
- Tier 1 (High Priority): assets with high energy intensity, weak regulatory compliance, and strong technical fit for deep retrofits
- Tier 2 (Optimization): assets that need data-led tuning, controls work, and step-by-step system upgrades
- Tier 3 (Deferred / Maintenance Only): assets with limited data or those marked for disposal, where only basic maintenance or easy wins make sense
- After you identify priority buildings, rank bundled measures instead of isolated projects. Pick from shallow, medium-depth, or deep retrofit packages. Sequence matters. Improve the envelope before resizing HVAC systems. Cut thermal load first so HVAC can be downsized, which lowers first cost and improves NPV [2].
Run the model again each budget cycle so the rankings reflect new retrofits, updated compliance deadlines, and new data.
The ranking tells you where to act. Scenario testing shows how far the budget can stretch.
Test CAPEX-constrained and carbon-aligned scenarios
Start with the Business-As-Usual (BAU) case. Calculate the NPV of doing nothing, including projected regulatory fines and rising energy costs. In New York City, for example, LL97 fines are calculated at $268 per metric ton of CO₂e over a building’s limit [2]. That turns inaction into a clear dollar risk that stakeholders can stack up against retrofit costs.
From there, compare at least two active scenarios:
- a CAPEX-constrained plan that aims for near-term ROI within a fixed budget
- a carbon-aligned plan that targets the deepest emissions cuts, even if payback takes longer
A minimum 10-year financial model is recommended for this work. Longer time frames of 20 years or more often show better paths for carbon reduction [2].
Use scenario modeling to compare the trade-offs between capital cost, risk, and carbon performance.
Use a comparison table to present scenarios side by side
Use the table below to compare budget, carbon, and risk outcomes before choosing a path.
| Scenario | Budget | Primary Objective | Expected kWh Savings | Expected CO₂e Reduction | Risk Reduction | Key Trade-offs |
|---|---|---|---|---|---|---|
| CAPEX-Constrained | $5,000,000 | Maximize NPV / short payback | Moderate | Moderate | Low | Misses deep decarbonization targets; higher long-term compliance risk |
| Carbon-Aligned | $10,000,000 | Net zero pathway / compliance | Very high | Very high | High | Higher upfront capital; longer payback; potential tenant disruption |
| Lifecycle-Integrated | Variable (aligned with CAPEX cycles) | Minimize disruption / protect asset value | High | High | Moderate | Requires long-term planning; savings accumulate gradually over 10+ years |
There’s no one right scenario for every portfolio. A portfolio facing near-term BPS pressure will usually lean toward the carbon-aligned path. One with tight short-term liquidity may start with the CAPEX-constrained plan, then phase into deeper retrofits as equipment reaches end of life.
Use the preferred scenario to build the multi-year investment roadmap in the next step.
4. Turn rankings into a multi-year retrofit roadmap
Once scoring and scenario testing are done, turn the preferred ranking into a phased capital plan.
Build an investment shortlist with clear decision metrics
Each project on the shortlist should be judged with the same yardstick: dollars, carbon, and risk.
| Building / Retrofit Package | CAPEX ($) | Annual Energy Savings ($) | Annual CO₂e Reduction (t) | Simple Payback (years) | NPV ($) | Cost per Ton ($/tCO₂e) | Risk Reduction |
|---|---|---|---|---|---|---|---|
| Candidate | – | – | – | – | – | – | – |
Use these metrics to sort projects into near-term, mid-term, and later waves.
CAPEX estimates should cover equipment, controls and BMS integration, installation, and related work like asbestos abatement or shaft wall repair [2]. It also helps to include rebates and incentives you can reasonably expect, including Inflation Reduction Act incentives for heat pumps, since those can improve NPV and shorten payback [2].
Don’t rank projects by payback alone. A fast payback can look good on paper, but it doesn’t always point to the best long-run move.
Phase projects to reduce disruption and improve lifecycle value
Use the shortlist to decide project order, then line up each wave with lease events, shutdown windows, and end-of-life replacements.
Tie retrofit work to equipment that’s nearing end of life and to tenant lease renewals. That lets you tap existing maintenance budgets and cut disruption [2]. It also pays to bundle envelope and HVAC work so load-reduction measures happen before equipment replacement. If you swap in new equipment before lowering the load, you may end up paying for more capacity than you need. Bundling related measures can also trim mobilization costs [2].
Keep the sequence tied to the same drivers used to score buildings:
- Cost
- Carbon
- Risk
- Occupancy disruption
- End-of-life timing
Track results and refresh the plan each year
After each project is delivered, compare actual savings with the model, then reset priorities for the next wave.
Update utility data, equipment condition assessments, and grid emissions factors each year, then rerun the prioritization [2]. Use 12-month commissioning to close the gap between modeled and measured savings [6]. If results come in below target, make adjustments before the next budget cycle and feed those lessons back into the prioritization model.
Conclusion: A repeatable framework for better retrofit decisions
Once you’ve set the scores and built the scenarios, the next step is turning that work into a capital plan. A strong retrofit process starts with clear goals, then moves through data, scoring, scenarios, and a phased plan. The point is simple: send limited CAPEX to the buildings and measures that deliver the best combined value.
The strongest plans look at combined value, not payback alone. That means ranking projects based on energy savings, CO₂e reduction, compliance risk, and asset performance at the same time.
This trade-off becomes much easier to read when you plot options side by side. Map each package by NPV and cumulative CO₂e reduction, and you can spot the strongest trade-offs across the portfolio fast.
Refresh the framework every year so the plan stays aligned with current risk, budget, and carbon targets.
FAQs
How do I weight cost, carbon, and compliance risk?
Use a multi-criteria scoring model instead of a static list. Start with a financial baseline that covers capital costs, maintenance savings, and possible non-compliance penalties. Then use NPV to compare the investment against the cost of doing nothing.
For carbon and risk, set weights based on how far each asset is from regulatory benchmarks, including EUI, carbon intensity, and mandate timing. Stress-test the inputs with sensitivity and scenario analysis so you can spot the projects that deliver the most value.
What if some buildings have incomplete or inconsistent data?
Use a tiered approach to prioritization so you don’t get stuck waiting for perfect data. Even with high-level inputs like building type, size, and location, you can still spot low-effort measures and decide on the right next steps.
When operational or metering data is available, use targeted analysis to find incremental improvements. It helps to group buildings by data maturity so you can keep work moving across the portfolio and compare options in a consistent way.
When should I choose a deep retrofit over smaller upgrades?
Choose a deep retrofit when you want to change how a building performs at a fundamental level. That usually means major envelope upgrades, electrification, and connected controls working together to help future-proof the asset. It fits projects aiming for major energy cuts – sometimes up to 80% – along with stronger long-term carbon savings.
Choose smaller upgrades when the goal is near-term efficiency gains, day-to-day tuning, or a lower-lift path because budget or data limits make faster improvements the better call.