


If you score condition, failure impact, and cost in one system, you can make better capital calls. That is the core point. Instead of relying on separate inspection files, risk notes, and budget sheets, I would put every asset into one ranked register and use that to decide whether to repair, replace, or defer.
Here’s the short version:
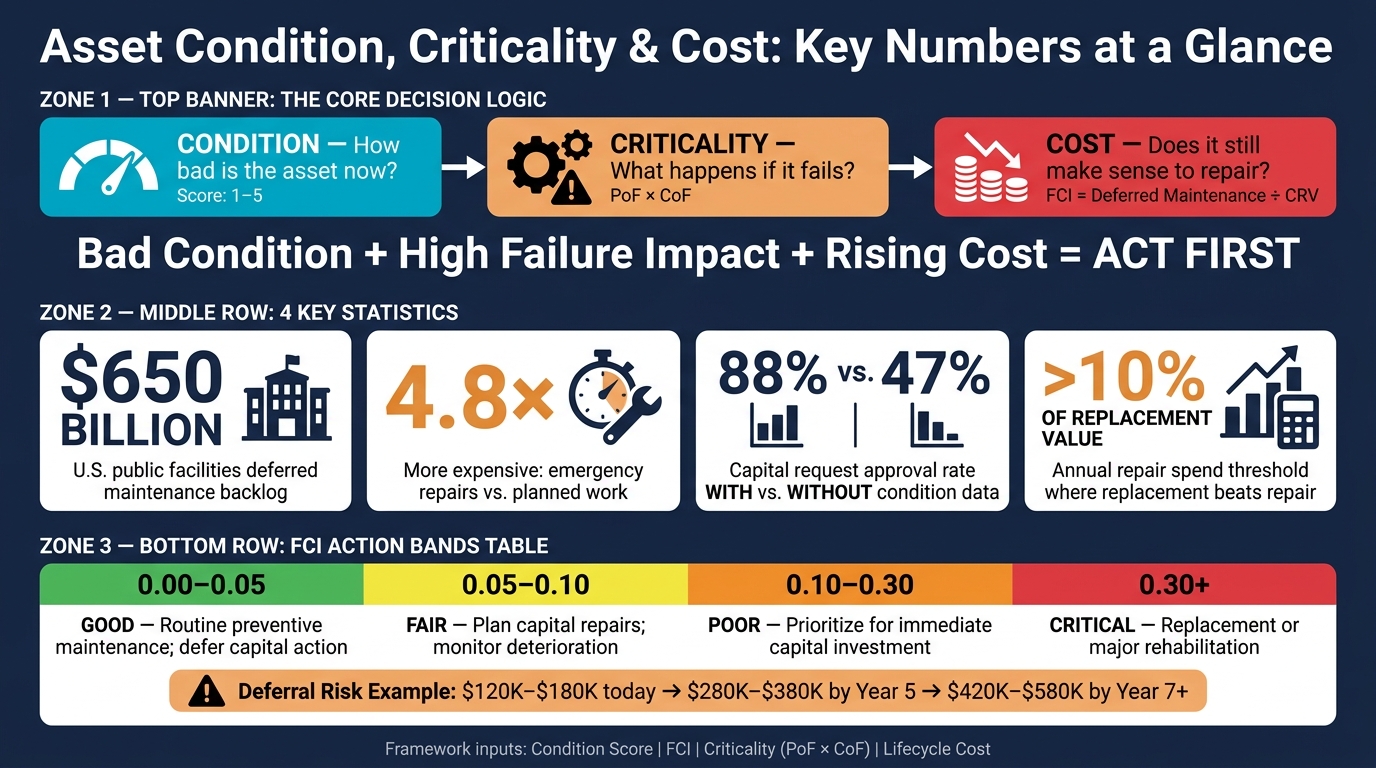
- Condition tells me how bad the asset is right now
- Criticality tells me what happens if it fails
- Cost tells me whether it still makes sense to keep fixing it
The article shows how to do this with a few plain rules:
- Use a 1–5 condition score
- Track FCI = deferred maintenance ÷ current replacement value
- Score criticality as probability of failure × impact of failure
- Compare repair spend vs. replacement cost
- Rank assets with fixed weights
- Set action bands for repair now, replace later, or defer with monitoring
- Test budget paths over 5 to 30 years
- Keep an audit trail for reviews and ISO 55001 checks
A few numbers stand out:
- U.S. public facilities face about $650 billion in deferred maintenance
- Emergency repairs can cost about 4.8x more than planned work
- Capital requests backed by condition data have an 88% approval rate vs. 47% without it
- If annual repair spend goes above 10% of replacement value, replacement often makes more sense
What I like here is the simple decision logic: bad condition + high failure impact + rising cost = move first. That turns scattered data into a ranked funding list you can explain in plain English.
In short, this framework helps me connect asset health, failure risk, and money in one view so long-range CAPEX planning is based on scores, not guesswork.
Asset Management Framework: Key Stats & Decision Thresholds
Intermediate Asset Management Series: Criticality
sbb-itb-5be7949
Define the three inputs before you prioritize
Before you rank assets, lock down three inputs: condition, criticality, and lifecycle cost.
The key is consistency. Use one asset ID, one scoring scale, and one review date across all three. If those inputs come from different systems or time periods, your ranking can get messy fast.
Score asset condition using inspection data, FCI, and remaining useful life
Use a 1–5 condition scale tied to your inspection criteria:
- 1 = excellent
- 5 = failed or near-failed
Each score should map to a clear set of observable defects in your portfolio. Don’t leave room for a vague middle score that means something different to each reviewer.
Then pair that condition score with the Facility Condition Index (FCI), calculated as:
FCI = Total Deferred Maintenance Cost ÷ Current Replacement Value (CRV)
A lower FCI means the asset is in better shape. In most cases, an FCI below 5% sits in the healthiest range, while 10% to 30% points to poor condition and the need for a prioritized capital program [2]. Update CRV every year so inflation and rising construction costs don’t skew the result.
Remaining useful life (RUL) fills in the rest of the picture. Two roofs can show the same FCI and still call for very different decisions. If one has only a few years of RUL left and the other has much more life in it, you’re not looking at the same risk. Estimate RUL using the install date, manufacturer life, maintenance history, and visible degradation.
Score criticality based on likelihood and consequence of failure
Criticality is about the impact of failure, not the asset’s physical state.
A simple way to express it is:
Criticality Score = Probability of Failure (PoF) × Consequence of Failure (CoF)
For PoF, use failure history, monitoring trends, and maintenance records. For CoF, score the effect across safety, environment, operations, quality, cost, and brand impact. Set those weightings before anyone starts scoring [8].
Score the worst credible failure scenario, not the most common one [8]. That distinction matters. A cooling tower pump may be more likely to see bearing wear than a catastrophic seal rupture, but the seal rupture is what should drive the consequence score.
This is one area where a single reviewer usually isn’t enough. Teams that include Operations, Maintenance, Safety, Engineering, and Finance tend to produce results that hold up better under scrutiny [8][9].
Estimate lifecycle cost in dollars, not just replacement cost
Replacement cost is only one piece of the puzzle.
You need to compare multi-year repair spend with the cost of replacing the asset now. A workable lifecycle cost view should include:
- Current Replacement Value (CRV)
- cumulative lifetime repair spend
- annual maintenance cost ratio
- downtime costs
One useful signal is annual repair spend divided by replacement value. If that ratio climbs above 10%, replacement is usually the better move [7].
These scores feed the condition-criticality-cost matrix used to rank repair, replacement, and deferral options. The next step is to compare those scores against each of those choices.
Build the condition-criticality-cost framework
Once you have steady condition scores, criticality ratings, and lifecycle cost estimates, the next step is to pull them into one repeatable model. This is where a pile of separate spreadsheets turns into a decision tool you can actually use. Build one asset register that combines condition, criticality, cost, and action. The goal is simple: put every asset in one place and rank it by risk and spend.
Create a condition-criticality-cost matrix for each asset
Build a one-row-per-asset matrix that puts every input in a single register. Each row should include the asset ID, condition score (FCI), criticality score, risk class, remaining useful life, annual maintenance cost, estimated renewal cost, and recommended action [5][3].
| Register Column | Purpose |
|---|---|
| Asset ID | Unique identifier; links to inspection records and work orders |
| Condition Score (FCI) | Condition indicator |
| Criticality Score | Risk indicator |
| Risk Class / Tier | Tier 1 (Critical), Tier 2 (Important), Tier 3 (Monitor) |
| Remaining Useful Life | Condition-adjusted estimate based on age, maintenance history, and visible degradation |
| Annual Maintenance Cost | Current OPEX spend; highlights costly outliers |
| Estimated Renewal Cost | Forward-projected replacement cost, inflation-adjusted |
| Recommended Action | Repair, Replace, or Defer with Monitoring |
Use the matrix to compare repair, replacement, and deferral on the same line. That side-by-side view makes the problem hard to ignore. The assets that rise to the top usually share the same pattern: high criticality, poor condition, and lifecycle cost nearing the point where replacement is cheaper than continued repair.
That gives you a cleaner way to explain each recommended action to management or a regulator. Instead of saying an asset feels risky, you can point to one row and show the condition, the impact, and the cost trend.
Once the matrix shows where the risk sits, weighting helps you decide what gets funded first.
Use weighted scoring to rank repair, replacement, and deferral options
Set fixed weights before you score anything. A common starting point is Safety & Regulatory (40%), Operational Impact (30%), Deterioration Rate (20%), and Cost Efficiency (10%) [5]. Score each asset from 1 to 5 on each criterion, multiply by the weight, and add the results to get one priority score.
| Criterion | Weight | Score (1–5) | Weighted Total |
|---|---|---|---|
| Safety & Regulatory | 40% | 5 | 2.0 |
| Operational Impact | 30% | 4 | 1.2 |
| Deterioration Rate | 20% | 3 | 0.6 |
| Cost Efficiency | 10% | 5 | 0.5 |
| Final Priority Rank | 100% | 4.3 / 5.0 |
Keep the severity definitions tied to your organization’s own risk profile. A $50,000 loss may be routine for a large utility but catastrophic for a smaller operation [8]. That context matters. The same score should not mean wildly different things across teams.
It also helps to bring Operations, Maintenance, Safety, and Engineering into the scoring process so the result stays steady and easier to defend [8]. If one group scores in isolation, the model can drift fast.
Software is what keeps that scoring from going stale as inspections and work orders change.
Use Simeo Inventory and Oxand Simeo™ to put the model into practice

The hardest part of this framework is not building it. It’s keeping it current. Static assessments can go stale in a matter of months, while dynamic FCI tracking updates scores as work orders close and new inspection data comes in [2]. Organizations using dynamic FCI tracking make capital allocation decisions 40% faster than those relying on static assessments [2].
Use Simeo Inventory to centralize asset data and Oxand Simeo™ to turn that data into 5–30 year CAPEX and OPEX scenarios. Simeo Inventory creates a standardized asset register across sites and buildings, capturing condition, criticality, and risk data at the component level.
With guided mobile inspections in Simeo GO, field teams can record scores, photos, and comments offline. Validation rules help cut gaps before data reaches the planning model. Oxand Simeo™ then simulates how each asset deteriorates over time and generates multi-year investment plans under budget, energy, and carbon constraints – technically grounded, financially traceable, and ready for ISO 55001 audits.
Turn scores into multi-year investment decisions
Use the ranked matrix from the prior section to put a date on each asset decision.
Set action thresholds for repair now, replace later, or defer with monitoring
Turn each score into a repair, replace, or defer call by using FCI bands with a criticality overlay[10]:
| FCI Band | Condition | Criticality Overlay | Recommended Action |
|---|---|---|---|
| 0.00–0.05 | Good | Any | Routine preventive maintenance; defer capital action |
| 0.05–0.10 | Fair | Low–Medium | Plan capital repairs; monitor deterioration |
| 0.10–0.30 | Poor | Medium–High | Prioritize for immediate capital investment or major repair |
| 0.30+ | Critical | Any | Replacement or major rehabilitation is typically more cost-effective than continued repair |
Here’s the idea in plain English: the score should lead to a deadline. If a hospital HVAC unit has an FCI above 0.12 and keeps generating reactive calls, it moves into the 0–12 month capital window. A high-consequence bridge element lands in that same near-term window.
Move too slowly, and costs can spike fast. That’s why early action matters.
Those action dates then feed your multi-year budget scenarios.
Model budget scenarios across 5–30 years
Once your thresholds are set, test what different funding levels do to the portfolio over time. A simple way to do that is to compare three paths – constrained-budget baseline, risk-reduction target, and carbon-reduction – and track backlog, risk exposure, and renewal timing under each one[1].
The cost curve can get ugly if work slips. A major HVAC unit that costs $120,000–$180,000 to address today can climb to $280,000–$380,000 by year five if deferred, and $420,000–$580,000 by year 7+ if replacement is delayed[10]. Put that same curve across the full asset register, not just one piece of equipment, and the budget talk changes. It stops being a line-item debate and starts looking like what it is: a risk decision.
Before you show any scenario to leadership, write down the assumptions behind it.
Document assumptions for boards, regulators, and ISO 55001 audits
If the plan can’t be traced back to its inputs, it won’t survive a capital committee review or an ISO 55001 audit. Every model decision needs a clear audit trail that covers:
- inspection dates
- condition ratings on a consistent 1–5 scale
- FCI formulas
- the exact weights used in the prioritization model
- the logic behind each scenario assumption[1][5][11]
Two items deserve extra attention.
First is the funding gap: the difference between what rehabilitation needs and what the budget allows. That number shows boards and regulators how a shortfall changes long-term portfolio risk[4].
Second is a data confidence score for each asset, based on how recent and complete the inspection data is[6]. A score built on recent, complete inspection data should carry more weight than one estimated from age alone.
An asset’s FCI and cascade risk multiplier, pulled straight from the matrix rows and priority scores, make the funding priority clear and easier to defend. It’s no longer a matter of who argues best in the room.
Link corrective work orders to updated scores so the register stays current.
Conclusion: A clear method to improve CAPEX allocation and long-term resilience
Once you rank assets and run scenario models, the path gets a lot easier to see. Put condition, criticality, and cost into one ranked asset register. Then use FCI, criticality, and lifecycle cost to rank each asset. That gives you a clear, traceable basis for deciding whether to repair, replace, or defer.
Deferral often pushes repair costs higher later. Scenario modeling brings that tradeoff into plain view and helps leadership understand what delaying work can cost over time.
A documented record of inspection dates, scoring rules, and weights also makes the plan easier to defend during capital reviews and ISO 55001 audits. And as new inspection data comes in, the scores can be updated, so the plan stays current instead of managing yesterday’s risk [12].
The outcome is a CAPEX plan that you can defend, update, and use for 5–30 year planning. That’s the practical payoff of using one framework for condition, criticality, and cost.
FAQs
How do I start if my asset data is incomplete?
You don’t need perfect data to get started. What you need is a defensible framework built on what you know, with clear notes on what you don’t.
Start by sorting assets into three confidence tiers:
- Tier 1: confirmed condition and cost data
- Tier 2: informed estimates
- Tier 3: missing or inherited data
Then focus condition assessments on the most critical Tier 3 assets, especially where the findings could change a financial or operational decision.
How often should I update condition, criticality, and cost scores?
Update condition, criticality, and cost data often enough to reflect meaningful changes in asset performance, completed projects, and new risks.
Many organizations review key assets each year and refresh broader assessments on a schedule tied to budgeting and capital planning. Keep the framework dynamic by using current inspection records, maintenance work orders, and sensor data.
What thresholds should trigger repair, replacement, or deferral?
Thresholds should be based on condition, risk, and impact – not fixed physical scores alone.
A lot of teams use a risk-based matrix for this. The idea is simple: when poor asset condition lines up with high operational impact, that asset moves to the front of the line.
A weighted scoring model can make those calls easier. It looks at factors like:
- Safety
- Compliance
- Strategic importance
- Cost consequence
Assets with low need and low impact can wait. Higher-risk assets should be handled first, which helps avoid more expensive emergency repairs later.
Related Blog Posts
- Infrastructure Asset Management: A Risk-Based Approach for Multi-Year CAPEX Planning
- From Maintenance Backlog to Investment Plan: Turning Fragmented Data into Clear CAPEX Decisions
- 90 Days to Your First Asset Investment Plan: A Step-by-Step Implementation Guide
- Aging Public Buildings in Europe: How to Sequence Renewal Under Tight Budgets