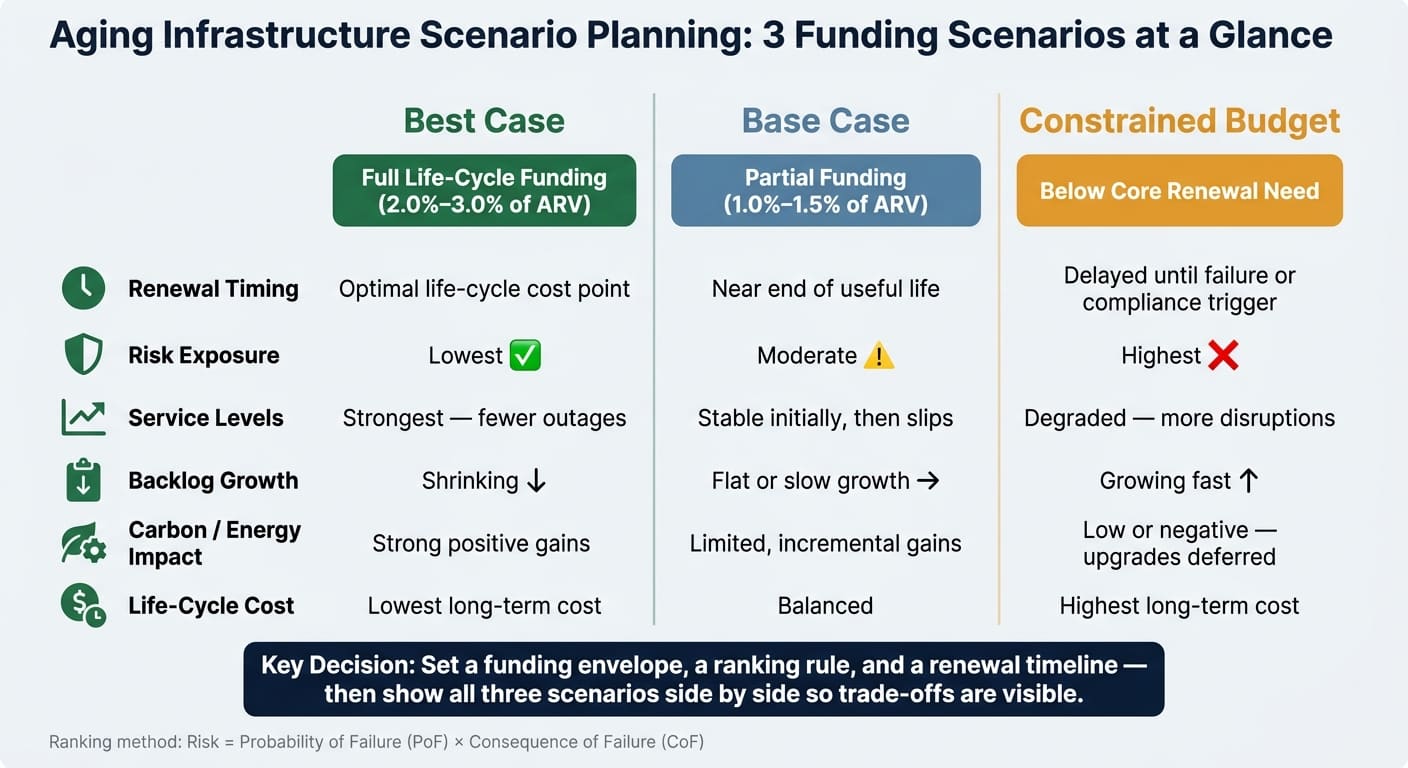
Aging Infrastructure Scenario Planning: Best Case, Base Case and Constrained Budget
If you fund aging assets at 1.0% to 1.5% of ARV instead of the 2.0% to 3.0% often needed for full life-cycle renewal, you don’t just delay work – you shift more money into failures, compliance, and backlog.
I’d sum the article up like this: scenario planning helps me show what changes under three funding paths – best case, base case, and constrained budget. The main differences come down to renewal timing, risk, service levels, backlog growth, carbon results, and where capital gets spent. When money gets tight, condition alone is not enough. I need to rank assets by Probability of Failure (PoF), Consequence of Failure (CoF), use FCI where it fits, and account for service and community impact.
Here’s the short version:
- Best case: full life-cycle funding, earlier renewals, lower long-run cost, shrinking backlog
- Base case: partial renewal, slower backlog control, more deferrals, tighter ranking rules
- Constrained budget: forced triage, more reactive work, growing backlog, weaker service
- Main lesson: funding level shapes risk, outages, carbon progress, and 30- to 50-year asset performance
- Decision need: set a funding envelope, a ranking rule, and a renewal timeline that people can defend
Aging Infrastructure Scenario Planning: Best Case vs Base Case vs Constrained Budget
Risk and Intervention for Aging Infrastructure
sbb-itb-5be7949
Quick Comparison
| Scenario | Funding Position | Renewal Timing | Risk | Service Levels | Backlog | Carbon / Energy |
|---|---|---|---|---|---|---|
| Best Case | Covers full program need | Done closer to the lowest life-cycle cost point | Lowest | Strongest | Shrinks | Best results |
| Base Case | Below full need; often 1.0%–1.5% of ARV | Pushed closer to end of useful life | Medium | Stable at first, then slips | Flat or slow growth | Smaller gains |
| Constrained Budget | Below core renewal need | Delayed until failure, emergency, or compliance trigger | Highest | More disruption and outages | Grows fast | Often delayed or cut |
So if I’m briefing a board, CFO, or public owner, the point is simple: don’t ask for one budget number in isolation. Show the three paths side by side so the trade-offs in cost, risk, service, backlog, and carbon are plain from the start.
1. Best Case Funding Scenario
In the best case, funding covers the full life-cycle program. That lets owners move away from reactive repairs and toward life-cycle cost optimization. Put simply: they can treat assets before wear and damage push repair costs much higher. This creates the benchmark for the base-case scenario, where some work has to wait.
Renewal Timing, Risk, and Service Levels
With best-case funding, owners can plan renewals when the work makes the most financial sense, not when an asset is close to failing. For roads, that means keeping pavement at a Good or Excellent rating before heavy deterioration begins. For bridges, it means scheduled retrofits instead of emergency closures.
The payoff is straightforward. There are fewer disruptions, less last-minute work, and steadier service levels across the portfolio.
That benchmark matters when funding gets tighter and renewal timing starts to slip.
Backlog and Budget Allocation
Best-case funding gives owners room to cut the deferred maintenance backlog while also protecting assets that are still in good condition. In other words, they can deal with yesterday’s problems without creating new ones.
The table below shows illustrative funding priorities:
| Priority | Primary Objective |
|---|---|
| Preventive maintenance | Keep good assets good; delivers the highest long-term value |
| Backlog reduction | Eliminate maintenance debt |
| Resilience upgrades | Flood barriers, seismic retrofits, climate hardening |
| Energy and carbon improvements | Energy retrofits, electrification, low-carbon materials |
Carbon and Energy Impact
Under best-case funding, carbon reduction becomes part of planned capital spending instead of being pushed aside as an extra item. Owners can take on the higher upfront cost of low-carbon materials such as recycled steel and lower-emission concrete mixes.
There is also a practical upside. When nearby bridge or road renewals are grouped together, mobilization costs go down, and construction activity leaves a smaller carbon footprint.
Use this baseline to measure what changes when funding drops below full need.
2. Base Case Funding Scenario
Compared with the best case, the base case allows only partial renewal and a slower reduction in backlog. This is the budget many owners deal with in practice: enough to handle urgent work, but not enough to pay for full life-cycle renewal. Annual funding often lands around 1.0% to 1.5% of ARV, which is below the 2.0% to 3.0% usually needed for full life-cycle renewal [4]. That shortfall is where the trade-offs start to bite.
Renewal Timing, Risk, and Service Levels
In a base case, renewals move away from the most cost-effective timing and closer to the point where the asset simply can’t wait any longer. Work gets pushed to just before Economic End of Life, when replacement costs less than continuing maintenance. Planners use what-if analysis to place condition items by year and to track deferrals through the Facility Condition Index (FCI) [2].
Service levels tend to stay stable at first. But renewal falls behind asset aging, so performance slips over time.
That funding gap also reshapes priorities. Risk doesn’t go away; it gets managed. High-consequence assets get funded first, while lower-criticality assets operate much closer to failure. Capital allocation usually follows a risk-based method defined as the product of Probability of Failure (PoF) and Consequence of Failure (CoF). A 5×5 risk matrix can help explain why a hidden trunk main may rank above a visible local road.
For roads and highways, planners may use cash flow what-if analysis to sort the order of priority for concurrent projects, such as highway construction and utility line replacement [3]. For bridges, decision support frameworks such as Multi-attribute Utility Theory (MAUT) and Markov decision processes can guide network-level maintenance investment plans [1].
Backlog and Budget Allocation
The backlog usually stays flat or grows slowly. Funding covers urgent work, but deferred maintenance doesn’t disappear. Up to 60% of capital may be tied up in compliance and emergency work, which leaves little room for planned renewal [4].
At this point, prioritization becomes the core discipline. Projects need to be ranked by:
- urgency
- criticality
- socioeconomic impact
Condition alone isn’t enough [1]. In building portfolios, teams should recalculate FCI each year to show how deferrals are affecting portfolio health [2].
Carbon and Energy Impact
At this funding level, carbon gains mostly come from replacements that have to happen anyway, not from broad upgrade programs. In plain terms, the gains are incremental. When an aging pump or motor reaches end of life and gets replaced, the newer unit is usually more energy-efficient, so emissions go down a bit as part of the normal renewal cycle. Large green upgrades are often deferred unless they pay back fast.
The practical move is to focus on projects with co-benefits. For example:
- a pipe replacement that also cuts energy-heavy leakage
- a renewal project that improves fire flow
- an asset swap that lowers energy use while addressing failure risk
The constrained-budget scenario pushes these same trade-offs even further, forcing even high-priority work to be sequenced more tightly and narrowed in scope.
3. Constrained Budget Scenario
When the base case can’t cover even core renewal needs, the portfolio stops operating in a planned way and starts making hard calls. This is no longer managed deferral. It’s forced triage.
A constrained budget pushes the portfolio out of planned renewal and into emergency response. Lifecycle planning takes a back seat to reactive spending, where failures and compliance work eat up the money that might have gone to planned rehab. Compared with the base case, fewer projects make it to renewal when they should, and more work gets triggered by breakdowns or regulatory deadlines.
Renewal Timing, Risk, and Service Levels
Under this setup, planning horizons get shorter. Long-range renewal work and resilience upgrades are pushed off for years.
That delay comes at a cost. Failure risk goes up. Lifecycle cost climbs. Service continuity gets weaker during extreme events. Assets stay in service past the base-case renewal window, so service levels start to slip. In plain terms, that means more unplanned outages and more disruption across roads, bridges, tunnels, and building portfolios.
Backlog and Budget Allocation
The deferred maintenance backlog grows fast in this scenario. Limited capital gets swallowed by emergency repairs and near-term regulatory compliance, leaving very little room for planned renewal or life-cycle value.
Spending also gets more fragmented. Instead of improving performance across the portfolio, teams end up funding isolated fixes just to keep things running.
In a constrained budget, PoF and CoF ranking becomes the main way to show why some projects get funded before others. It also helps create an audit trail for management and regulators. That trade-off stands out most clearly when the scenarios are compared side by side.
Carbon and Energy Impact
The same budget pressure that delays renewal also delays sustainability upgrades. Carbon and energy work is often the first thing cut.
That leaves older, less efficient equipment in service for longer. Any efficiency gains show up late, and often only after a failure forces replacement.
Trade-Offs, Pros, and Cons by Scenario
Use the three scenarios to compare funding choices, not to build three separate plans.
Each scenario shifts value in a different way across owners, finance teams, and regulators. In practice, the trade-off usually comes down to one of three things: risk and service continuity, affordability and debt capacity, or compliance and auditability.
The best case needs the most money up front. But it also delivers the strongest long-term performance and is the easiest option to defend with regulators and ESG investors. The base case is usually the easiest sell inside the organization because it fits standard mandates and supports stable service levels. The constrained budget option protects short-term affordability, but there’s a catch: it pushes risk into the future and adds to the backlog.
That’s the heart of the decision. The point isn’t just to pick a scenario. It’s to turn these trade-offs into a funding envelope, a ranking rule, and a renewal timeline.
Documentation needs change too. The best case calls for multi-objective modeling. The base case leans on standard compliance reporting. Constrained budgets need a clear explanation of risk thresholds and why those limits are acceptable.
When resilience benefits are quantified, the conversation starts to shift. Instead of looking at investment as a pure cost, teams can judge it as value. The table below pulls those trade-offs into one decision view.
| Dimension | Best Case | Base Case | Constrained Budget |
|---|---|---|---|
| Risk Exposure | Lowest | Moderate | Highest |
| Service Levels | Strongest | Stable | Degraded |
| Backlog Growth | Shrinking | Flat | Growing |
| Carbon Impact | Strong positive | Limited | Low or negative |
| Life-Cycle Cost | Lowest | Balanced | Highest |
| Governance Burden | High; multi-objective modeling required | Moderate; standard compliance reporting | High; explicit risk-threshold justification required |
| Ease of Justification | Strong for regulators and ESG investors; weaker for rate-sensitive boards | Easiest internally; aligns with standard mandates | Strong for finance teams focused on affordability; low for regulators |
Review the scenario set every year and after any major budget shift, major failure, or regulatory change.
Conclusion
A single budget request never shows the whole picture. When you lay out a best-case, base-case, and constrained budget, decision-makers can see the full spread of cost, risk, and resilience outcomes.
Taken together, these three scenarios show the full decision range for aging assets. Each one supports a different kind of call: optimize, balance, or triage. Across risk exposure, service levels, backlog growth, and carbon outcomes, the funding level shapes how the portfolio performs over the next 30 to 50 years.
Boards and CFOs make better calls when long-term exposure is quantified using a risk-based approach. That means documenting assumptions, ranking criteria, funding envelopes, 30- to 50-year timelines, and the trade-offs across risk, service, backlog, and carbon. When those details are on the table, the case stands up much better under scrutiny.
The big change is moving from one forecast to a portfolio of options. Scenario planning makes uncertainty easier to see, points to no-regret investments, and gives decision-makers a path they can defend under any approved budget. It also makes the investment case easier to defend, track, and revise as conditions change.
FAQs
How do I choose between best case, base case, and constrained budget planning?
Model how your assets perform at each funding level so you can compare the trade-offs in risk, service levels, and long-term costs.
Then line up current asset conditions against your target objectives and apply prioritization criteria, such as benefit-cost ratios, to see which projects fit within each budget. That gives you a clearer way to justify spending by showing how each funding level shapes asset health and performance over time.
What data do I need to build a risk-based scenario plan for aging assets?
You need a core dataset that covers asset inventory, current condition, and performance.
That means collecting physical details like:
- Material
- Age
- Installation date and method
- Condition assessment results
- Performance history
- Failure history
- Outside factors such as soil corrosivity and traffic loads
You’ll also want financial data in the mix. That includes revenue projections, expenditure estimates, and cost escalation.
On top of that, use performance models to estimate:
- Deterioration over time
- Remaining service life
- The impact of different investment strategies
Put simply, the goal is to build a dataset that shows what you own, what shape it’s in, how it has behaved, what it may cost, and what might happen next.
How often should I update infrastructure funding scenarios and priorities?
Update them often as financial conditions, asset performance, and available data change. Even with long-term plans that stretch 10 years or more, scenarios and priorities need regular review.
That way, your investment plan reflects inflation, rising costs, and shifts in what matters most – so it stays decision-ready and audit-ready.
Related Blog Posts
- Aging Infrastructure in Europe: How to Prioritise Renewal Under Budget Constraints
- Climate Change Adaptation for Aging Assets: Where to Invest First
- Funding Challenges: Innovative Solutions for Revitalising Outdated Infrastructure
- Aging Schools and Public Buildings: How to Phase Investments Over 10 Years