








If I had to boil this down to one point, it would be this: I should plan capital across the whole portfolio, not one building at a time. That is how I can rank repairs, retrofits, and renewals by risk, cost, timing, and carbon impact – then turn that into a 5-, 10-, or 20-year CAPEX plan.
Here’s the short version:
- I start with one standard asset dataset across all properties
- I score projects by failure risk and CO2e reduction per dollar
- I test budget scenarios before locking in spend
- I sequence work around lease timing, end-of-life dates, and compliance deadlines
- I document assumptions so finance, ESG, and auditors can follow every number
A few figures stand out:
- Portfolio managers often see 1%–2% annual energy-efficiency gains
- Retrofit rates may need to grow by 2x to 3x to track with a 1.5°C path
- One portfolio screening effort flagged 9 buildings with about $834,350 in annual savings and 2,271 metric tons CO2e cut
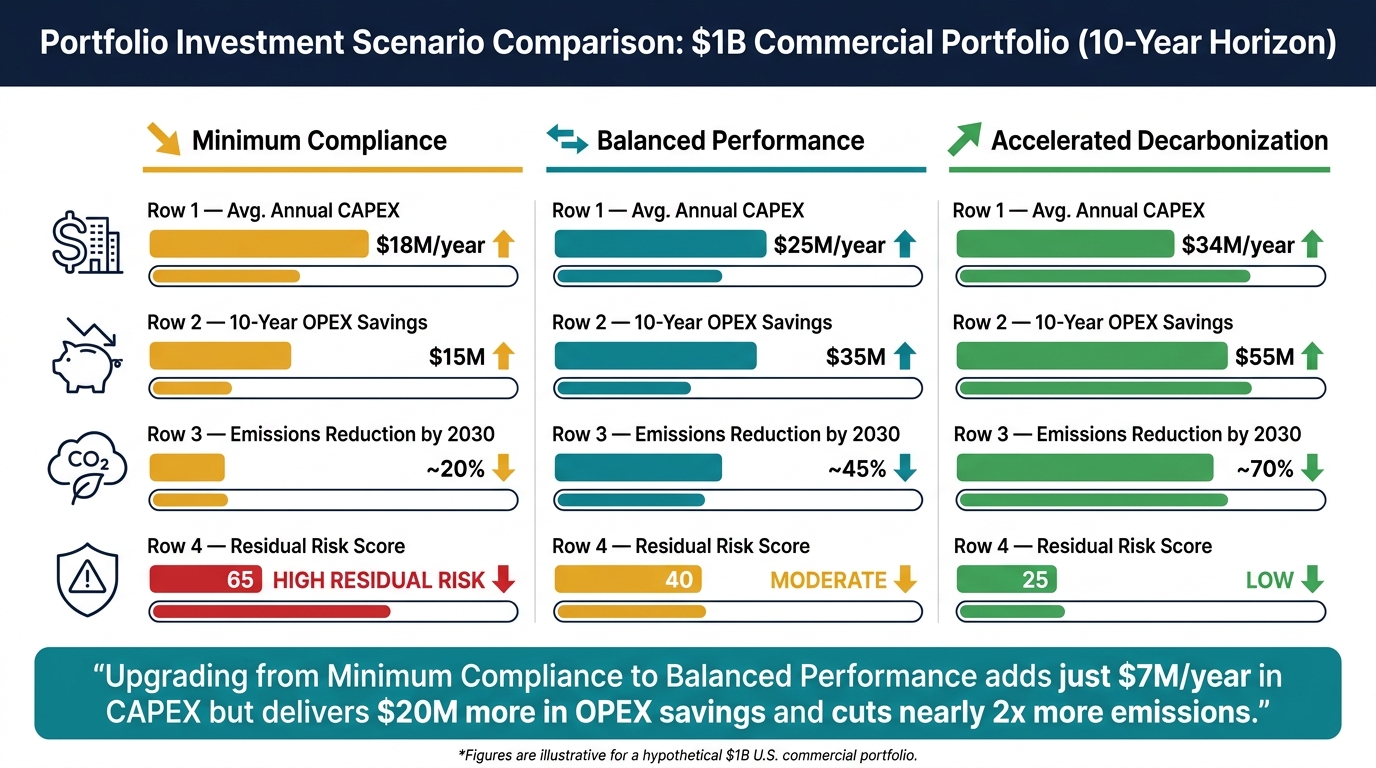
- In a sample $1 billion portfolio, moving from a low-spend path to a balanced one added $7 million per year in CAPEX but produced $20 million more in 10-year OPEX savings
What this article shows is simple: clean data first, ranked priorities next, scenario testing after that, and then an audit-ready roadmap. That gives me a clear way to decide which systems to fund, in which buildings, and when.
Commercial Real Estate Portfolio Investment Scenarios: CAPEX vs. Savings vs. Carbon Reduction
1. Build the portfolio data foundation before setting budgets
Start with one portfolio data model for every building, system, and component. If each property tracks assets in its own way, capital planning turns messy fast. You can’t compare like-for-like, and risk-and-carbon ranking falls apart.
That shared model is what lets teams line up needs across the portfolio and make budget calls on the same basis.
Create a standardized inventory across buildings and systems
The first step is a hierarchical asset register that works the same way for every property: portfolio → site → building → system → subsystem → component.
Each roof section, HVAC unit, electrical panel, and fire protection system should be logged with the same core fields:
- asset type
- installation date
- age
- remaining useful life
- condition rating
- replacement cost in USD
- criticality
- maintenance history
Replacement costs should follow the same portfolio-wide cost benchmarks in $/sq ft. That way, a chiller replacement in one building is priced the same way as a similar unit somewhere else. If teams use different pricing logic by site, comparisons stop meaning much.
Condition ratings also need one objective scale across the full portfolio. Tie that scale to things people can actually observe, like visible defects, performance against design specs, and failure frequency. Otherwise, a "good" rating in one building may mean something very different in another.
Oxand Simeo Inventory is built for this job. It organizes asset data in a standard hierarchy across sites and building types, keeps naming and scoring consistent, and gives inspection teams a guided mobile workflow through Simeo GO so findings go straight into the register.
Capture condition, risk, energy, and carbon in one dataset
Once the inventory is in place, the next move is to add the data that turns a plain asset list into a tool for budget decisions. In practice, that means pulling condition ratings, failure probability, business criticality, utility consumption, and emissions into one record for each asset.
Energy data should be normalized by floor area. kWh/sq ft is the metric ENERGY STAR uses to compare buildings of different sizes [2]. Emissions should be tracked in metric tons CO₂e per year, using EPA or utility-specific emission factors.
Why does that matter? Because it shows which assets deserve attention first. A California portfolio screening program used energy and carbon benchmarking to identify nine buildings for investment-grade audits, with estimated annual savings of $834,350 and 2,271 metric tons CO₂e [3].
Oxand Simeo™ ties these data streams together – inspection findings, failure probability, utility bills, and emissions metrics – into one audit-ready knowledge base. Every figure is traceable: which emission factors were used, when the condition was last checked, and who updated the record. When leadership or auditors ask how the plan was built, that paper trail matters.
Build the inventory first. Then use it to score and budget retrofit, renewal, and maintenance work.
2. Prioritize retrofit, renewal, and maintenance using risk and carbon criteria
Once your portfolio data is in place, the next step is deciding what gets fixed first.
That sounds simple. It isn’t.
Age by itself doesn’t tell you much. A 15-year-old chiller in a downtown office tower is not the same kind of issue as a 15-year-old lobby refresh. What matters is failure impact.
Use a risk-based scoring model for capital decisions
Score each critical system for probability of failure and consequence of failure on a 1–5 scale. Then multiply the two numbers to get a risk index.
Probability should reflect condition assessment findings, age compared with ASHRAE equipment life benchmarks, maintenance history, and operating stress. Consequence should cover safety and regulatory impact, business interruption, tenant comfort and brand impact, plus the cost gap between emergency replacement and planned renewal. It should also account for climate exposure. Flood, storm, and extreme heat can move critical systems much higher in the queue.[4]
Here’s a clear example from a downtown office portfolio. A failing chiller serving a 500,000 sq ft tower might score a 4 for probability and a 5 for consequence. That produces a risk score of 20. A lobby refurbishment in the same building might score a 1 and a 2, for a risk score of 2.[4]
That’s the point of the model: it helps teams stop treating all old assets like they carry the same level of urgency.
Add energy and CO2e impact to the ranking logic
Risk scoring alone won’t get a portfolio to its decarbonization goals.
You need a second layer in the model: energy savings and emissions reduction.
For each project, estimate annual kWh and therms saved. Convert those savings into metric tons of CO2e avoided per year. Then rank projects by CO2e avoided per $1,000 of CAPEX. Put those results into the same ranking model so risk and carbon stay tied to the same capital call.
The table below shows how common intervention types stack up across the criteria that matter most in portfolio prioritization:
| Intervention | Typical CAPEX | Risk Reduction | Payback | Energy Savings | CO2e Impact |
|---|---|---|---|---|---|
| HVAC modernization (chiller, heat pump) | $1M–$5M+ | High | 7–15 years | 10–30% of building energy | High |
| Controls and building automation upgrades | $200K–$800K | Medium | 3–7 years | 10–20% of building energy | Moderate to High |
| LED lighting and controls | $100K–$500K | Low to Medium | 2–5 years | 30–60% of lighting load; ~5–15% of whole-building energy | Moderate |
| Envelope improvements (insulation, glazing, air sealing) | $500K–$5M+ | High where facade issues exist | 10–20+ years | 10–25% of building energy | Substantial |
The Empire State Building retrofit makes this concrete. Selective upgrades cut chiller-plant CAPEX by more than $17 million while still lowering energy use.[5]
To bring the pieces together, use a weighted composite score. One practical setup is:
- 40% risk
- 30% CO2e reduction normalized by CAPEX
- 20% financial return, such as payback, NPV, or IRR
- 10% other factors, such as tenant retention or local regulatory deadlines
With that setup, every project gets one composite score. The ranked list then feeds scenario modeling and the multi-year CAPEX roadmap.
Compare prioritization methods to avoid poor investment logic
Most portfolios rely on some mix of three methods: risk-based, age-based, and compliance-driven.
Each method has a place. Each also breaks down when used alone.
| Method | Strength | Limitation | Best Use |
|---|---|---|---|
| Risk-based | Focuses capital where failure impact is highest; defensible and data-driven | Requires condition data and scoring discipline to work well | Primary method for critical systems and resilience investments |
| Age-based | Simple to apply; useful as an initial screening tool | Ignores condition, maintenance history, and consequence – can trigger premature replacement or miss high-risk assets | Flag assets for deeper risk assessment, not as the final decision rule |
| Compliance-driven | Ensures regulatory deadlines such as Building Performance Standards or local energy codes are met | Can push spending toward minimum compliance rather than highest-impact investments | Validate that compliance measures also align with long-term risk and carbon goals |
Age can help inform probability, but it shouldn’t decide priority on its own. Use the ranked list to test different budget and carbon paths before you lock in the roadmap.
3. Turn priorities into portfolio scenarios and a multi-year CAPEX roadmap
Scenario modeling turns a ranked project list into a clear spend-and-taging plan: what to fund now, what to push back, and what each option is likely to deliver. Put simply, this is where priorities become budget paths and timing rules.
Model investment scenarios for different budget and carbon paths
Use three paths: minimum compliance, balanced performance, and accelerated decarbonization.
- Minimum Compliance meets regulatory deadlines with the lowest spend.
- Balanced Performance aims for a middle ground between risk reduction and emissions cuts.
- Accelerated Decarbonization moves deep retrofits and electrification earlier to cut carbon at a faster pace.
The figures below are illustrative, not prescriptive, for a hypothetical $1 billion U.S. commercial portfolio over a 10-year period:
| Scenario | Avg. Annual CAPEX | 10-Year OPEX Savings | Emissions Reduction by 2030 | Residual Risk Score |
|---|---|---|---|---|
| Minimum Compliance | $18M | $15M | ~20% | 65 (high residual risk) |
| Balanced Performance | $25M | $35M | ~45% | 40 |
| Accelerated Decarbonization | $34M | $55M | ~70% | 25 |
These figures make the trade-offs easier to see. Moving from minimum compliance to balanced performance adds about $7 million per year in CAPEX, but it also delivers $20 million more in OPEX savings and cuts nearly twice as much emissions. That kind of side-by-side view can shift a budget discussion from “What does it cost?” to “What do we get for the extra spend?”
Oxand Simeo™ can act as the calculation engine here. It can build budget caps, carbon targets, and risk thresholds into the scenario logic, so the outputs are traceable and comparable, not just rough spreadsheet math.
Sequence projects into a 5- to 20-year roadmap
Once a scenario is selected, the next job is sequencing. That’s what turns a model into a delivery schedule.
Life-safety and compliance items usually come first, often in years 1 to 3. High-consequence systems that are near end of life should also move up the line. A central chiller serving a fully leased Class A office tower is a good example. If it fails before replacement is planned, the result is an unplanned project, more pressure, and often a bigger bill.
After that, timing should line up with lease expirations and known vacancy windows. That matters for intrusive work like HVAC distribution upgrades or window replacements, where active tenant disruption can become a major problem. In retail and mixed-use assets, disruptive work often makes more sense during lower-traffic periods.
Bundling work can also trim mobilization and contractor costs. For example, combining rooftop unit replacement, roof membrane renewal, and rooftop solar installation into one mobilization can make the schedule cleaner and the spend easier to manage. At the same time, smooth annual CAPEX so you avoid sharp budget spikes while still meeting carbon and risk targets at the five-, ten-, and twenty-year points.
That roadmap then becomes the basis for the audit-ready investment plan and business case.
sbb-itb-5be7949
4. Produce an audit-ready investment plan and business case for action
A roadmap only helps if leadership, finance, ESG, auditors, and site teams can all read it, trust it, and use it. So the analysis has to be packaged into clear deliverables, with each number tied back to stated assumptions.
Define the core deliverables for leadership, auditors, and operations teams
These outputs turn ranked portfolio priorities into action, funding, and ownership. The table below shows the six core deliverables and the teams that depend on them most.
| Deliverable | What It Contains | Primary Audience |
|---|---|---|
| Prioritized project list | Project name, asset/building, scope, risk score, carbon impact, estimated CAPEX/OPEX, timing, dependencies, and sortable fields for IRR and payback | Board, Finance, ESG, Auditors |
| Multi-year CAPEX/OPEX plan | Annual CAPEX by building, system, and program, plus incremental OPEX changes over the planning horizon, in USD and GAAP-aligned capital and expense categories, with inflation, discount rate, and escalation assumptions | Finance, Auditors |
| Funding priorities and strategy | Tiered funding matrix (Priority 1–3) using criteria such as life-safety, compliance, ROI, and carbon, with capital sources such as general CAPEX, green bonds, PACE financing, and tax credits | Board, Finance |
| Decarbonization trajectory | Baseline emissions in metric tons CO₂e/year, interim targets for 2030 and 2040, project-by-project reduction estimates versus business-as-usual, and alignment with corporate targets and any SBTi or Net Zero commitments | ESG, Investors, Auditors |
| Portfolio risk register | Asset and system risks with likelihood, impact, risk owner, mitigation project, and residual risk score | Board, Auditors |
| Board summary | Top decisions, trade-offs, portfolio ROI, CO₂ reductions, risk reduction, and key uncertainties in plain English | Board, Investors |
Each deliverable should tie back to the same numbers, assumptions, and source data. That’s what makes the plan audit-ready instead of just neat and well formatted. From there, the focus shifts to building a business case people can defend.
Build a defensible business case with traceable assumptions
Once the outputs are set, document the assumptions behind them. Approval lives or dies on documentation.
Use the same risk scores, CAPEX estimates, and carbon assumptions that shaped the roadmap. Record replacement costs, discount rates, asset life, and avoided-failure costs with the source, date, and reason for each input. Discount rates should line up with your corporate WACC or hurdle rate, which is often 6% to 10% for commercial real estate. It also helps to run sensitivity checks at two other rates so decision-makers can see that NPV still holds up under different assumptions.
Avoided failure costs need hard numbers too. That can include emergency repair premiums, tenant rent concessions, regulatory penalties, and lost lease revenue. Put simply, you’re showing the price of doing nothing [1].
For energy and carbon benefits, use EPA eGRID emission factors for your local grid and report results in metric tons CO₂e per year. Keep calculation sheets or system exports that show the formulas for NPV, IRR, and payback for key projects, with inputs linked back to documented assumptions. If someone asks, “Where did this number come from?” you should be able to answer in minutes, not days.
Oxand Simeo™ supports this documentation layer by generating ISO 55001-aligned, audit-ready outputs from the same planning model used to build scenarios and roadmaps. In practice, that means the assumptions behind a project’s priority score, lifecycle cost estimate, and carbon benefit all live in one place instead of being spread across spreadsheets that slowly drift apart.
The aim is a plan that stays traceable, explainable, and simple to update as conditions shift. That’s what helps a team move from approval to execution without going back to rebuild the case.
Conclusion: A practical portfolio approach to commercial real estate investment
Start by building a normalized portfolio dataset. Then rank projects by risk and carbon, test scenarios, and publish an audit-ready CAPEX roadmap. That setup turns scattered capital requests into one clear decision framework.
Looking across a full portfolio helps you spot patterns that a one-building review won’t show. Research synthesized by GRESB suggests portfolios can capture around 20% energy savings through operational optimization alone before any major CAPEX is deployed [6]. That’s the kind of finding you only get when you compare assets side by side instead of treating each property as its own island.
At the portfolio level, cost, resilience, and decarbonization often move in the same direction. Replacing failure-prone systems with efficient equipment can cut risk, improve comfort, and lower emissions at the same time. A portfolio view shows where those overlaps are strongest, so capital goes where it matters most across retrofit, renewal, and maintenance work.
If you want the plan to get approved, document the assumptions behind every number. Each CAPEX estimate, carbon factor, and discount rate should have a clear source or rationale. Sensitivity checks help show that the numbers still make sense when assumptions change. That’s often the line between a plan that moves forward and one that gets stuck in review.
For teams getting started now, the path is pretty direct: within 12 months, define standards, validate data, test scenarios, and approve the roadmap. That gives finance, ESG, and operations teams a shared basis for budgeting and execution.
FAQs
How do I start with incomplete portfolio data?
Start by building a centralized asset register that serves as your single source of truth, with standardized data across all properties.
When records are missing or inconsistent, you still have options. You can use predictive modeling based on available benchmarks, temporary loggers for real-time tracking, or manual site inspections using a standardized 1–5 condition rating scale.
That way, data gaps don’t just sit there. They become actionable metrics you can use to prioritize investments.
What should I prioritize first under a tight budget?
Prioritize investments by ranking buildings with a combined score for cost, carbon impact, compliance risk, and timing – not energy use alone.
Set clear objectives and constraints from the start. That means things like capital expenditure limits, regulatory deadlines, and equipment end-of-life. Then use a standardized asset inventory to size up risk and return across the portfolio, bundle work where it makes sense, and model different scenarios to find the best mix of savings and risk reduction.
How often should I update the CAPEX roadmap?
Update your CAPEX roadmap every year. That gives you a clean checkpoint to compare modeled savings against actual results, rerun project rankings, and reset targets based on what’s happened so far.
You should also update Current Replacement Value (CRV) each year to reflect inflation, which is often 5% to 7%. Document the assumptions used in every scoring cycle so the plan stays clear, audit-ready, and aligned with long-term decarbonization and financial goals.
Related Blog Posts
- Achieving Net-Zero in Real Estate Portfolios: From Targets to Investment Plans
- Zero-Emission Buildings 2028 and 2030: How to Phase Your Investment Plan Now
- Carbon vs. Cost vs. Comfort: How to Make Better Building Investment Decisions
- What a Good Decarbonisation Investment Plan Looks Like in Practice