


Buildings are at the center of Europe’s carbon reduction efforts, responsible for 40% of energy use and 36% of greenhouse emissions. Yet, 75% of EU buildings are energy-inefficient, and renovation rates remain low at just 1% annually. The revised Energy Performance of Buildings Directive (EPBD) targets a decarbonized building stock by 2050, requiring data-driven renovation strategies to meet compliance milestones.
Key takeaways:
- By 2030, the least efficient 16% of non-residential buildings must be renovated, increasing to 26% by 2033.
- Maintenance data from CMMS (Computerized Maintenance Management Systems) and BMS (Building Management Systems) is critical for tracking energy use, identifying inefficiencies, and planning renovations.
- Tools like sub-metering, digital refrigerant logs, and centralized asset registers help close data gaps and ensure audit readiness.
- Prioritizing building envelope improvements and HVAC upgrades supports EPBD compliance while reducing energy waste.
- Predictive planning tools enable renovation scenarios that align with EPBD deadlines and optimize cost-effectiveness.
Actionable insights: Use CMMS and BMS data to pinpoint inefficiencies, create structured renovation plans, and monitor compliance progress. This approach ensures you meet EPBD goals while improving energy performance and cutting costs.
Energy Performance of Buildings Directive (EPBD) explained – whole-life carbon requirements
sbb-itb-5be7949
EPBD Requirements and the Role of Maintenance Data
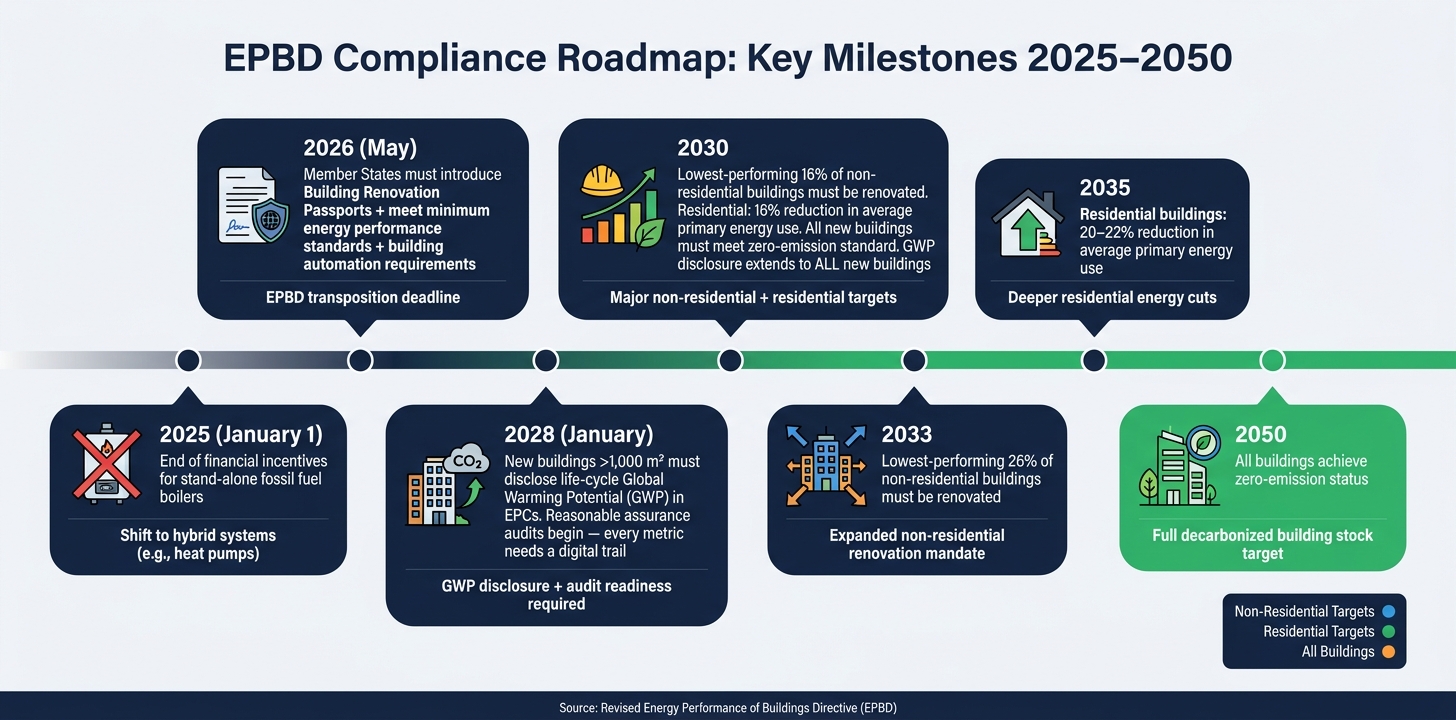
EPBD Compliance Roadmap: Key Milestones 2025–2050
Key EPBD Milestones and Compliance Areas
The EPBD outlines a clear roadmap for building owners and asset managers, focusing on energy efficiency and sustainability goals. By 2030, the lowest-performing 16% of non-residential buildings must be renovated, with this figure increasing to 26% by 2033 [1]. On the residential side, Member States are tasked with reducing average primary energy use by 16% by 2030 and achieving a reduction of 20–22% by 2035 [1].
Looking ahead, the ultimate target is for all buildings to achieve zero-emission status by 2050, with new buildings required to meet this standard starting in 2030 [1][2]. Additional milestones include the end of financial incentives for stand-alone fossil fuel boilers as of January 1, 2025. This shift encourages the adoption of hybrid systems, such as those incorporating heat pumps [1]. Moreover, starting in January 2028, new buildings over 1,000 m² (approximately 10,764 ft²) must disclose their life-cycle global warming potential (GWP) in their Energy Performance Certificates (EPCs). By 2030, this disclosure will apply to all new buildings [1].
Mapping Maintenance Data to EPBD Requirements
Data from CMMS (Computerized Maintenance Management Systems) and BMS (Building Management Systems) plays a critical role in meeting EPBD compliance. These systems already capture much of the information needed, but integrating this data into a cohesive reporting framework is essential. For example, HVAC systems account for 40–60% of a building’s total energy use [5], making detailed asset-level tracking a priority.
Here’s how specific data fields from CMMS and BMS align with EPBD requirements:
| EPBD Requirement | CMMS Data Fields | BMS Data Fields |
|---|---|---|
| Energy Performance Certificates (EPCs) | Asset age, maintenance history, PM compliance rate | Asset-level kWh, COP/EER trends |
| Technical Building System Inspections | Fault history, MTTR | System runtimes, alarm logs |
| F-Gas / Refrigerant Compliance | Refrigerant type, quantity, GWP, leak check dates | – |
| Scope 1/2 Emissions (CSRD/ESRS E1) | Boiler fuel logs, furnace runtime | Compressor data, sub-meter readings |
| BACS Requirements | – | Occupancy-based controls, energy monitoring logs |
"CSRD compliance is not a finance department problem. It’s a data problem, and the data starts at the machine." – Riley Quinn, ESG Reporting Specialist [6]
The stakes will rise even higher with the introduction of reasonable assurance audits in 2028. Every reported metric will need to be backed by a clear digital trail, connecting it to specific work orders or meter readings. Manual spreadsheets simply won’t cut it [6].
Closing Data Gaps for EPBD Compliance
While existing data systems cover many compliance needs, certain gaps must be addressed to ensure full alignment with EPBD requirements.
One common issue is incomplete asset inventories or reliance on aggregated energy data. Whole-building utility bills, for instance, make it difficult to identify underperforming assets or show targeted improvements. To bridge this gap, sub-metering is essential. Linking BMS or IoT meters to high-load assets – like chillers, boilers, and air handling units – can help clarify discrepancies between utility bills and actual asset performance [6][7].
Additionally, digitizing paper records, such as refrigerant logbooks, is a must. Digital F-gas logs tied directly to assets ensure that GWP-weighted quantities and certified engineer sign-offs are readily accessible for audits [5].
"The revised EPBD is not only a regulatory shift, but also a signal that operational efficiency and digitalization are becoming central parts of modern real estate management." – Myrspoven [7]
A centralized, standardized asset register within your CMMS is crucial. Without a reliable inventory, even the best BMS data becomes difficult to act upon. By addressing these gaps, building managers can better connect maintenance data to sustainable renovation efforts, aligning operations with EPBD targets.
Preparing CMMS and BMS Data for Renovation Planning
To align with EPBD objectives, maintenance data must be organized, cleaned, and structured effectively. Here’s how to get started.
Key Data Fields for Renovation Planning
Not all data fields are equally relevant. Focus on those that connect asset conditions to energy performance and financial outcomes.
| Data Category | Key Fields | Source System |
|---|---|---|
| Asset Identity | Building typology, year of construction, conditioned floor area, cadastral reference | CMMS / Registry |
| Condition & Risk | Component degradation state, failure history, risk distribution, remaining useful life | CMMS / Inspections |
| Energy Performance | kWh usage trends, U-values of envelope, HVAC efficiency, PV potential | BMS / Energy Audit |
| Financials | Estimated investment costs, NPV, life cycle cost (LCC), available national subsidies/grants | ERP / Planning Tools |
| Environment | CO₂ intensity (lbs CO₂eq/ft²), ventilation rates, moisture conditions | BMS / IoT Sensors |
Key financial metrics, like life cycle cost (LCC) and net present value (NPV), are often overlooked early in the process. However, they play a crucial role in convincing budget committees and boards to approve deeper renovations.
After identifying the essential data fields, the next step is to integrate and standardize this information from various sources.
How to Clean and Standardize Maintenance Data
The biggest challenge isn’t missing data – it’s fragmented data. Many organizations rely on a mix of CMMS exports, spreadsheet logs, and BMS feeds that don’t integrate well. This leads to isolated datasets that are tough to compare or aggregate [9][10].
To tackle this, consolidate all data sources into a single platform. Cross-referencing 24–36 months of utility consumption data against calculated energy demand can reveal hidden issues, like air leakage in the building envelope or oversized, inefficient HVAC systems [11]. Ensure energy data is consistently measured in kilowatt-hours and environmental data in GHG equivalents to allow fair comparisons across assets. For legacy records with missing information, AI-driven aging models can estimate degradation data, avoiding the need to exclude incomplete records [9]. Mobile inspection tools can further validate theoretical data with real-world observations, enabling field teams to convert on-site findings into structured digital records instantly [9][10].
Once data is cleaned and standardized, the next critical step is to establish a centralized asset register.
Building a Centralized Asset Register
A centralized asset register serves as the backbone of renovation planning, creating a consistent inventory where CMMS and BMS data can be integrated and utilized effectively.
Oxand Simeo™ offers a solution tailored for this purpose. It seamlessly ingests data from CMMS systems, BMS feeds, BIM models, and even legacy spreadsheets through REST and GraphQL APIs. This eliminates the need for manual data exports [9]. The Simeo GO mobile app complements this by allowing field inspectors to capture photos, condition scores, and detailed component information directly from the site [9][10].
One public sector asset director shared their success with the platform:
"Simeo reduced our maintenance backlog by 27% and enabled us to achieve €4 million in energy savings across 66 buildings during the first budget cycle." – Asset Director, Public Sector Portfolio [9]
Organizations can typically import existing data and begin running multi-year investment scenarios within two weeks [9][13]. By structuring data this way, you ensure renovation plans are grounded in solid maintenance data, helping meet EPBD compliance goals while driving long-term improvements.
Identifying Energy Inefficiencies Using Maintenance Data
Once your data is centralized and cleaned, it’s time to put it to work. Maintenance logs and Building Management System (BMS) feeds hold valuable clues about energy waste – if you know where to look.
Common Signs of Energy Inefficiency in Maintenance Data
Standardized data makes it easier to uncover hidden inefficiencies that lead to energy waste. Often, these issues are buried in maintenance records, sensor data, or work order histories rather than utility bills. For instance, simultaneous heating and cooling in adjacent zones is a problem in 68% of buildings, wasting 10%–20% of annual HVAC energy consumption[3]. Similarly, 39% of buildings run HVAC systems during unoccupied hours, such as nights and weekends, unnecessarily consuming energy for empty spaces[3].
Other common issues include failed or miscalibrated temperature sensors, which affect 54% of buildings and can result in over-conditioning by 3–5°F[3]. Additionally, 47% of buildings have economizer dampers that are stuck or have broken linkages, completely negating the benefits of "free cooling"[3].
| Asset | Energy Deviation Signal | Common Root Cause |
|---|---|---|
| Chiller | 22% above baseline kW/ton | Condenser coil fouling or scale build-up[15] |
| AHU Supply Fan | 18% above 30-day avg fan kW | Blocked filters or bypass damper issues[15] |
| CHW Pump | 31% above design pump kW | Impeller wear or pump running off curve[15] |
| Cooling Tower | 14% above baseline fan kW | Worn drive belts or 12% slip detected[15] |
Methods for Analyzing Maintenance and Operational Data
Linking BMS sensor data directly to your Computerized Maintenance Management System (CMMS) enables automated fault detection. This approach can reduce the time it takes to act on issues from hours down to seconds[14][4].
A useful strategy is to establish a rolling 30-day energy baseline for each asset after commissioning. Any energy spike of 15%–20% above this baseline should trigger an automatic work order[15][16]. For chillers, centrifugal units should operate within 0.45 to 0.60 kW/ton; anything above 0.65 kW/ton might point to fouling or refrigerant problems[16]. Similarly, monitor fan energy as a percentage of total AHU output – a rising percentage often signals filter loading or belt wear.
Cross-referencing preventive maintenance (PM) records with energy trends can reveal performance drift, which typically results in a 15%–30% efficiency loss. This can happen when sensors drift, control sequences are overridden, or equipment ages without proper intervention[3]. Degraded assets that go unnoticed between scheduled PMs can lead to an average energy waste of 23%[15].
"The fundamental problem with energy management in multi-site facilities portfolios is that energy data and maintenance data live in completely separate systems." – Dr. Anita Rajan, Director of Sustainability and Building Performance[16]
Quantifying these inefficiencies directly supports compliance with the Energy Performance of Buildings Directive (EPBD).
Linking Inefficiencies to EPBD Compliance Goals
Integrating these findings into your compliance strategy creates a direct link between daily operations and long-term EPBD renovation targets. For example, a stuck economizer damper highlights a measurable gap in your building’s energy performance. Similarly, a miscalibrated temperature sensor can inflate operational carbon emissions and negatively impact your Energy Performance Certificate (EPC) ratings.
Addressing these inefficiencies aligns with the EPBD’s goals of continuous improvement in energy efficiency and carbon reduction[5]. Structured CMMS records also play a vital role in compliance. Under the EU F-Gas Regulation 517/2014, systems exceeding certain Global Warming Potential (GWP) thresholds require documented refrigerant charge logs and leak checks. Paper records often fall short during audits, but digital CMMS systems ensure you’re audit-ready[5].
The financial impact of maintenance actions is another key factor for gaining internal support:
"When the maintenance team can show the CFO that the quarterly condenser cleaning program delivered $28,000 in confirmed energy savings last year at a cost of $4,200 in labor and materials, the budget conversation changes completely." – Dr. Claire Forsythe, Director of Engineering and Sustainability[15]
Building Risk-Based, EPBD-Aligned Renovation Plans
When it comes to energy-efficient renovations, focusing investments where they make the most impact is key. By analyzing maintenance data, you can pinpoint where energy inefficiencies occur and then decide what needs to be addressed first. Some issues may only require minor adjustments, while others could lead to non-compliance if ignored. Structuring your renovation plan around risk and impact – rather than relying solely on intuition or available budgets – can turn reactive spending into a more strategic approach. This ties operational insights to long-term EPBD (Energy Performance of Buildings Directive) goals.
Ranking Renovation Measures by Risk and Impact
To prioritize renovation projects effectively, evaluate each measure based on several factors: energy savings potential (kWh), carbon reduction (GHG), asset condition, and regulatory exposure. For example, a project that significantly cuts energy costs while addressing compliance risks should take precedence over one offering modest savings without regulatory benefits.
A "fabric first" strategy is often recommended. This means prioritizing improvements to the building envelope – like insulation, windows, and air sealing – before moving on to HVAC upgrades. This avoids the "lock-in" effect, where early decisions limit future efficiency gains. Comparing interventions using metrics like cost per kWh saved or cost per ton of CO₂ reduced ensures that decisions are consistent across options, whether you’re considering a boiler replacement or roof insulation.
Using Predictive Planning Tools for Scenario Analysis
Choosing which projects to tackle is only part of the equation – understanding how different sequences of investments perform over time under budget constraints is just as important. Tools like Oxand Simeo™ use extensive datasets, including 10,000 aging and energy models and 30,000 maintenance actions, to predict how assets will degrade and how energy use will evolve over time [9].
This predictive capability allows you to simulate various renovation pathways. For instance, you could compare a conservative plan that meets minimum EPBD thresholds against an accelerated plan aimed at achieving Zero-Emission Building status. These simulations provide a side-by-side view of capital expenditures (CAPEX), operational expenses (OPEX), and carbon outcomes, helping you make informed decisions.
A good example comes from In’li, a social housing organization. By using Oxand Simeo™, they moved from reactive to predictive investment planning, integrating energy performance goals directly into their portfolio management [12]. Organizations adopting this approach often see a return on investment within 6 to 12 months and can cut total ownership costs by up to 30% [9].
Aligning Renovation Plans with EPBD Timelines
Your renovation plan must align with the EPBD’s clear deadlines. For instance, Member States are required to introduce Building Renovation Passports by May 2026, along with meeting minimum energy performance standards and building automation requirements [8]. To meet these milestones, your investment roadmap should be carefully structured.
By ranking measures based on risk and impact, you can create a phased renovation plan that aligns with EPBD goals over a 10–15 year timeline. For example:
- Phase 1: Focus on building envelope improvements, such as insulation and air sealing, to enhance energy performance.
- Phase 2: Upgrade HVAC systems and integrate building automation features to meet upcoming regulatory standards.
This phased approach also allows you to coordinate renovations with scheduled maintenance. For instance, adding insulation during a planned roof replacement avoids the need for a separate project later.
Simeo™’s Dynamic Planner helps manage these timelines by allowing adjustments to project timing and costs as budgets shift, ensuring compliance milestones stay on track. This creates a flexible renovation roadmap that adapts to changing circumstances while keeping EPBD goals in focus.
Monitoring EPBD Compliance Over Time
Once risk-based renovation plans are in place, keeping tabs on EPBD compliance is crucial to ensure those plans deliver consistent results. Renovations only remain effective when performance is actively monitored, tracking energy use and carbon emissions while addressing any deviations before they lead to compliance challenges.
Defining KPIs for Energy and Asset Performance
The EPBD outlines specific targets, so your KPIs should align with these goals. For example, Primary Energy Use (kWh/m²/year) is a key metric, as the directive mandates a 16% reduction in average residential primary energy use by 2030 and a 20–22% reduction by 2035 [1]. Additionally, life-cycle Global Warming Potential (GWP), measured in kgCO₂e/m², will require mandatory disclosure for new buildings over 1,000 m² (approximately 10,764 ft²) starting in January 2028, and for all new buildings by January 2030 [1].
Beyond these core metrics, other indicators like the Smart Readiness Indicator (SRI), Indoor Environmental Quality (IEQ), and renovation depth (the percentage of properties undergoing deep versus minor renovations) are equally important. Here’s how these KPIs connect to EPBD objectives:
| KPI | Indicator | EPBD Relevance |
|---|---|---|
| Energy Performance | Primary Energy Use (kWh/m²/y) | Supports 2030/2035 reduction targets |
| Decarbonization | Life-cycle GWP (kgCO₂e/m²) | Mandatory disclosure (2028/2030) |
| Operational | On-site Fossil Fuel Consumption | Aligns with phasing out standalone fossil fuel boilers |
| Modernization | Smart Readiness Indicator (SRI) | Facilitates demand-side flexibility and grid integration |
| Health/Safety | Indoor Environmental Quality (IEQ) | Ensures energy savings without compromising air quality |
| Renovation | Renovation Depth (%) | Measures progress toward Zero-Emission Building (ZEB) goals |
Your Building Management System (BMS) collects real-time energy data, while your Computerized Maintenance Management System (CMMS) tracks equipment-level maintenance. Together, these systems provide detailed asset performance data. Once KPIs are defined and monitored, integrating them into a continuous improvement framework ensures long-term compliance.
Building a Continuous Improvement Loop
Monitoring isn’t a one-and-done task – it’s an ongoing process. By linking BMS sensor alerts with CMMS, you can automate work orders, bridging the gap between identifying issues and addressing them promptly.
Neglecting maintenance can lead to significant energy inefficiencies. For example, poorly maintained HVAC systems may use 25–35% more energy compared to those with preventive maintenance programs [17]. Similarly, clogged air filters in air handling units can increase fan energy consumption by 22%, while just 1 mm of scale buildup in chiller tubes can reduce efficiency by 15% [17]. By tying preventive maintenance records directly to energy data, you can see the impact of maintenance on energy performance, ensuring every service event contributes to measurable improvements.
As renovations are completed, updated performance data should feed into your planning models. Dynamic Renovation Passports make this seamless by replacing baseline data with actual performance figures, keeping your compliance strategy up-to-date [8].
Consistent monitoring and accurate documentation are essential for robust compliance reporting.
Documenting and Reporting Compliance Progress
Compliance isn’t just about hitting performance targets – you also need to demonstrate how you achieved them. A cloud-based CMMS can help maintain audit-ready records linked to specific assets. This is particularly critical for refrigerant records, which must be kept for at least five years under EU Regulation 517/2014 [5], and for preventive maintenance logs, which serve as indicators of effective management.
Adopting ISO 55001-compliant asset management practices can further reinforce the credibility of your compliance reports. Tools like Oxand Simeo™ simplify the process by generating audit-ready plans from the same data used in scenario modeling, saving time and effort during regulatory submissions. As Xander van Baarsen aptly put it:
"The EPBD is not a single deadline with a single action. It is the legal foundation for a series of escalating requirements through 2030 and beyond." [18]
Conclusion: Using Maintenance Data to Meet EPBD Goals
CMMS and BMS data are no longer just tools for day-to-day operations – they’ve become essential for meeting compliance goals. As outlined earlier, integrating this data can pinpoint inefficiencies like energy waste through work orders and uncover issues like control failures or scheduling gaps via trend logs. These insights provide a solid foundation for renovation plans based on real performance data instead of guesswork.
Fixing operational issues identified through BMS data – such as adjusting schedules, fine-tuning setpoints, or repairing faulty sensors – can lead to energy savings of 5–15%. This progress is especially important as EPBD requirements become stricter heading toward 2030 and beyond. Additionally, CMMS data, including failure histories and energy usage trends, helps determine which buildings and systems should be prioritized for deeper investments.
A strong strategy builds on these savings through a continuous improvement process: tracking performance indicators, documenting actions taken, and refining renovation plans as new data emerges. For example, one Asset Director overseeing 66 public sector buildings achieved a 27% reduction in maintenance backlog and saved $4 million in energy costs – all within a single budget cycle [9].
Oxand Simeo™ simplifies this process even further by combining CMMS and BMS data into a single planning platform. It enables multi-scenario simulations, generates audit-ready reports, and cuts compliance preparation time by up to 70% [13]. This streamlined approach supports a renovation strategy that is efficient, adaptable, and ready for the future.
The end result? A renovation plan that satisfies regulators, appeals to financial stakeholders, and stays on track with EPBD milestones – from the 2030 minimum energy performance standards to the ultimate goal of zero-emission buildings by 2050.
FAQs
What EPBD data should I pull first from my CMMS and BMS?
To align with EPBD compliance, it’s crucial to gather data that links the condition of your assets to their energy performance. Start with your Building Management System (BMS) by honing in on HVAC metrics, energy consumption patterns, and operational setpoints – these will help you uncover inefficiencies in your system.
Next, dive into your Computerized Maintenance Management System (CMMS) for maintenance records, energy-specific work orders, and asset condition ratings. Don’t overlook deferred maintenance lists and sensor calibration logs, as these provide valuable insights into system efficiency and highlight areas where energy might be wasted. By combining data from both systems, you can better identify and address energy performance gaps.
How do I close major EPBD data gaps like missing sub-metering and refrigerant logs?
To tackle data gaps such as missing sub-metering or refrigerant logs, begin with an audit of your existing infrastructure. This helps identify where additional hardware is required and where legacy systems can be integrated. Tools like smart meters, pulse counters, or wireless sensors can provide real-time energy data. For refrigerant logs, consider digitizing the process by recording leaks as work orders and scheduling maintenance checks based on runtime hours. Streamlining and consolidating this data not only ensures compliance but also reduces the chances of manual tracking mistakes.
What KPIs should I track to prove EPBD compliance over time?
To show compliance with the EPBD, focus on tracking energy performance and sustainability metrics across individual buildings and entire portfolios. Important benchmarks include primary energy demand (measured in kWh/m²/year), greenhouse gas emissions intensity (calculated in kgCO₂eq/m²/year), and progress in EPC class as you move toward zero-emission targets.
On the operational side, keep an eye on preventive maintenance schedules, energy use intensity, energy-related work order trends, and Smart Readiness Indicator (SRI) scores. These metrics help demonstrate the integration of smart technologies and the energy or carbon savings achieved.
Related Blog Posts
- Energy Savings and Emissions Reduction: The Hidden ROI of Predictive Maintenance
- EPBD 2026: What the 29 May Transposition Deadline Means for Asset Owners
- National Building Renovation Plans: How to Turn Policy into a Portfolio Investment Strategy
- Maintenance Data, EPC Data and Renovation Passports: Why Integration Matters More in 2026