








U.S. cities are short by $2.588 trillion on infrastructure, and many projects still run late or over budget. If I were starting an investment plan today, I would not wait for perfect data. I would build a basic asset list, score condition and risk, flag high-energy assets, and turn that into a 5- to 20-year spending plan.
Here’s the short version:
- Start with a basic asset baseline. List the assets that matter most first, such as roads, bridges, buildings, schools, and utilities.
- Score condition and risk. Look at age, inspections, repair history, and what happens if an asset fails.
- Add energy and carbon data. Focus on assets that are both high-risk and high-cost to run.
- Build a phased roadmap. Match top projects to budget limits, funding sources, and yearly capital plans.
- Update the plan each year. Fix the biggest data gaps first and compare forecasts with actual results.
The core idea is simple: don’t spend based only on what looks worst today. Spend where service loss, safety issues, future cost, and energy waste hit hardest.
A few numbers stand out:
- 43.6% infrastructure funding shortfall
- 63% of capital projects go over budget
- 72% run behind schedule
- Poor early planning can push project costs up by 264%
If I had to sum up the article in one line, it would be this: start small, rank what matters, and make trade-offs visible.
This guide then walks through those first steps in plain terms so you can move from scattered asset data to a clear investment roadmap.
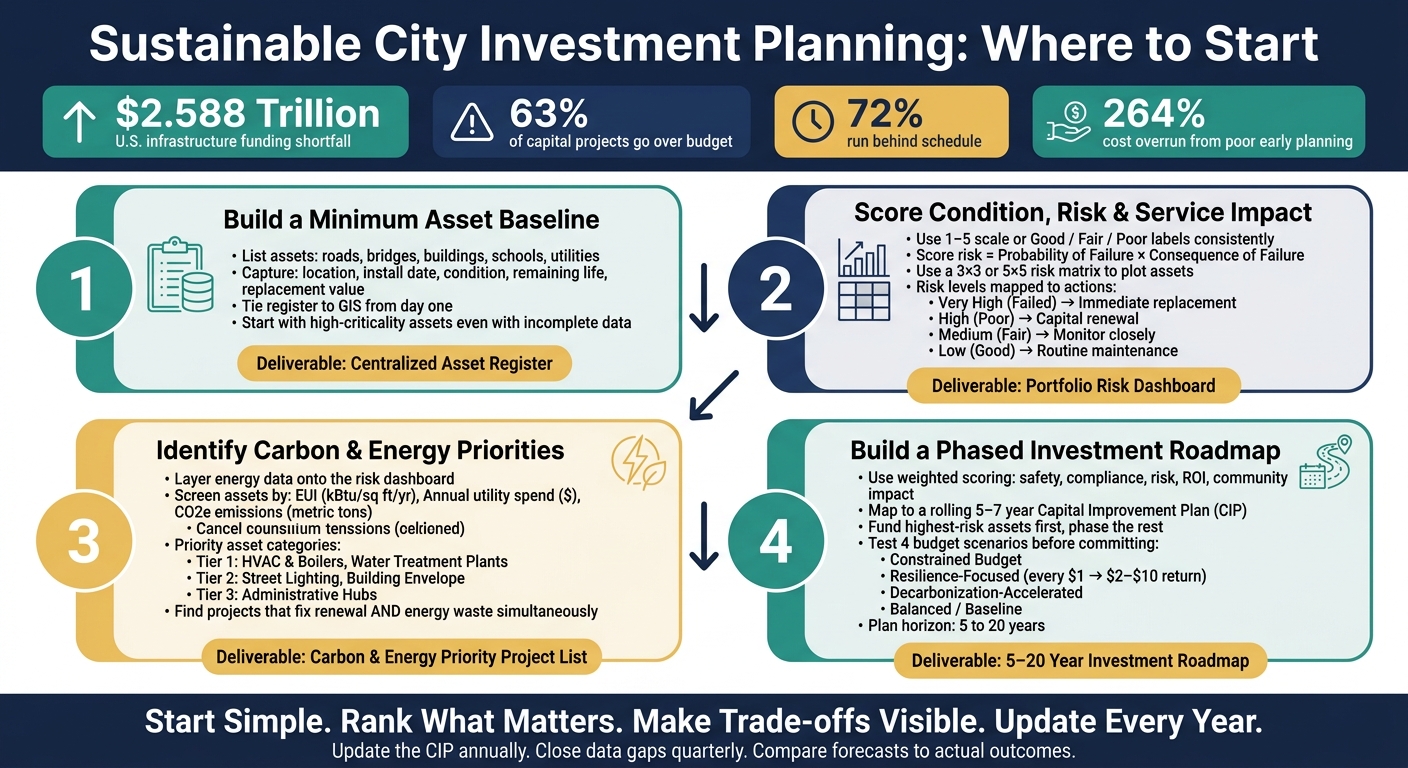
Sustainable City Investment Planning: 4-Step Framework
Planning Ahead Long Range Planning for Infrastructure Investment
sbb-itb-5be7949
1. Build a minimum asset baseline before setting priorities
Start with a minimum baseline: enough structured asset data to support defensible spending calls, not a perfect record of every single asset. When money is tight, the first task is figuring out which assets have the biggest effect on service, safety, and future costs.
Set up a centralized asset register with the right fields
A usable baseline should answer six basic questions: what you own, how many units you have, where each asset is, when it was installed or replaced, what condition it is in, and how much life it has left [4].
For public portfolios, the first-pass fields that matter most are:
| Asset Category | Core Fields to Capture | Condition Standard |
|---|---|---|
| Roads/Pavement | Location, width/length, material, installation date | Pavement Condition Index (PCI) [5] |
| Bridges | Location, span length, type, last inspection date | National Bridge Inventory (NBI) standards [1] |
| Buildings | Square footage, use type, HVAC age, roof condition | Facility Condition Index (FCI) [3] |
| Parks, playgrounds, and recreation assets | Equipment type, safety surface type, installation date | Visual safety inspection [5] |
Add replacement value and maintenance cost history too. Without those fields, leadership can’t see the full size of the portfolio or the price of doing nothing [3][4].
From day one, tie the register to GIS. When each asset is linked to a location, field data can be mapped right away [5]. It also helps stop departments from running separate spreadsheets that slowly drift out of sync with the main record [6].
From there, put your attention on the assets whose failure would hit service delivery and safety the hardest.
This baseline gives you the starting point for condition scoring, risk ranking, and spending decisions.
Start with high-criticality assets, even with incomplete data
Begin with the assets that would cause the most damage if they failed – bridges, major road corridors, hospitals, schools, and central government facilities [2]. If your data is patchy, these are the places where missing information matters most.
When records are missing, close the highest-value gaps first, especially asset age and material type [4]. And if hard records don’t exist, institutional knowledge from long-serving staff is still a fair starting source [5].
"If a method can’t survive a 10-minute council explanation, it won’t survive a fiscal year. In municipal practice, the question rarely is ‘what’s the best model?’; it’s ‘what’s the next step we can defend, fund and repeat?’" – Alence Poudel, P.E., Senior Engineering Manager, City of Sugar Land [6]
A San Diego audit found that infrastructure projects with weak initial planning cost 264% more than original estimates [3]. That’s a steep penalty. Putting a structured baseline in place – even if it’s only partial – can cut that risk in a big way.
First deliverable: a shareable asset baseline
The first deliverable is a shared, standardized asset baseline with clear data rules, consistent scoring, and one source of truth for planning.
Once that baseline is in place, the next move is to turn it into condition and risk priorities.
2. Turn baseline data into condition, risk, and service-level views
Once you have an asset baseline, the next job is to make it usable. A list of install dates, square footage, and inspection notes won’t tell you where to spend money. To do that, you need three plain views: condition, risk, and service impact. In other words, what shape is the asset in, how likely is it to cause trouble, and what happens if it fails? That’s what turns a static inventory into a tool for decisions.
Score condition using inspections, history, and asset age
Keep the scoring simple. A 1–5 numeric scale or labels like Good, Fair, Poor works well, as long as you apply the same method across asset classes. That consistency is what lets you compare one asset to another [3][8].
If inspection data is limited, there are two solid backup options. One is age-based scoring: compare the asset’s current age to its expected useful life to estimate condition without sending someone into the field [8]. The other is work order history: repeated repair requests, known defects, or recurring failures can stand in for poor condition when no formal inspection exists [5].
Rank risk by combining condition with consequence of failure
Condition by itself doesn’t set the pecking order. Risk comes from pairing probability of failure with consequence of failure. Probability usually reflects condition, age, and performance history. Consequence covers safety, service disruption, compliance risk, financial impact, and community impact [8][3]. Service impact should also be tracked in plain terms: does failure reduce access, cut capacity, or disrupt a critical operation?
A practical way to score this is with a 3×3 or 5×5 risk matrix. Plot each asset by how likely it is to fail and how serious the outcome would be. Assets that land in the high-likelihood, high-consequence corner move to the top of the list [6][7]. When you score consequence, put the most weight on public safety and regulatory compliance [3]. That risk view then becomes the screen for the carbon and energy opportunities in the next step.
The table below links risk levels to the condition you’ll often see and the action that usually follows:
| Risk Level | Typical Condition | Likely Action |
|---|---|---|
| Very High | Failed | Immediate replacement or renewal |
| High | Poor (Score 4) | Prioritize for capital renewal or major repair |
| Medium | Fair (Score 3) | Increase maintenance and monitor closely |
| Low | Good | Routine maintenance and periodic inspection |
Second deliverable: a portfolio risk dashboard for leadership
The main output here is a risk dashboard. Think of it as one view leaders can scan to see where risk is piling up across roads, bridges, buildings, and other public facilities. Each asset’s risk score should connect back to a service reason, not just a number.
Use that dashboard to show where risk is concentrated and which assets have the biggest service impact. That same view also tees up the next step: lining up high-risk assets with energy and carbon priorities.
3. Identify carbon and energy priorities that belong in the investment plan
Use the risk dashboard from Step 2 to spot assets where failure cost and energy cost hit the same place. Then layer energy and emissions data onto that view. That makes it easier to see where renewal work and decarbonization point to the same project.
The aim is simple: find projects that fix both issues at once and should sit in the same capital plan as renewal work.
Map high-use, high-emission assets first
Start with assets that use a lot of energy and also carry high service risk. In many municipal portfolios, that often means HVAC-heavy public buildings, water treatment plants, and street lighting networks. Networked assets like water treatment plants and telecommunications hubs should move up the list early, because a single failure can disrupt more than one service [7].
Use three screens to sort the list:
- EUI (kBtu per square foot per year)
- Annual utility spend in USD
- Estimated metric tons of CO2e per asset [9]
Once you’ve identified the high-use assets, score them for lifecycle need and carbon reduction potential.
Combine lifecycle need with energy and carbon opportunity
This is where the exercise starts to pay off. You’re not just finding assets in poor condition. You’re finding projects that deal with renewal pressure and energy waste at the same time.
Score projects based on condition, risk, energy savings, and carbon reduction. That gives leadership a stronger funding case. A project that fixes a safety or reliability issue and cuts operating costs is usually much easier to defend than a project that solves only one problem.
"Adaptation is no longer an optional or a sunk cost; it’s infrastructure that can be funded, scaled and designed to last." – Katrina Kelly-Pitou, Director of Climate Change Adaptation and Economics, SmithGroup [7]
Third deliverable: a short list of carbon and energy priority projects
The output here is a tight project list: the top items where renewal need and energy savings overlap. Each entry should include the asset, its current condition and risk tier, annual utility spend, and a projection of savings and emissions reduction if the project goes ahead.
The table below shows one way to set up that list by asset category:
| Asset Category | Energy/Carbon Impact Drivers | Priority Level |
|---|---|---|
| HVAC & Boilers (public buildings) | High electricity/gas use; aging equipment | Tier 1 |
| Water Treatment Plants | High energy use; potential for cascading service failure | Tier 1 |
| Street Lighting Networks | High electricity use | Tier 2 |
| Building Envelope | Thermal loss; durability concerns | Tier 2 |
| Administrative Hubs | Operational energy use | Tier 3 |
Use scenario analysis to test how these priorities hold up under different budget paths. That list becomes the starting point for budgeted phasing in the next step.
4. Build the first risk-based investment roadmap under budget constraints
Use the baseline, risk dashboard, and carbon priority list to turn your ranked projects into a funded roadmap.
Score and phase projects under real budget limits
Start by converting the ranked list into a sequence of projects you can actually pay for. A weighted scoring model helps you rank work based on safety and health, regulatory compliance, risk, financial return, and community impact [3].
Next, map those projects to the CIP, or multi-year capital budget. A rolling 5-to-7-year CIP, updated each year, gives you room to phase work without loading too much cost into one budget cycle. Wake County, North Carolina, is a good example. The county uses a rolling 7-year CIP with an 80% debt and 20% cash funding mix, which has helped it keep a AAA credit rating and stable tax rates [3].
The basic idea is simple: fund the highest-risk assets first, then phase the rest based on consequence and available budget.
Test scenarios before committing funds
Before locking anything in, run the roadmap through a few budget cases. That shows decision-makers what changes when money gets tight, when resilience moves to the front of the line, or when carbon work is pushed ahead.
| Scenario | Primary Focus | Key Trade-off |
|---|---|---|
| Constrained Budget | Fiscal limit adherence | Higher long-term risk; more deferral |
| Resilience-Focused | Hardening critical assets | Higher upfront CAPEX; every $1 spent can yield $2 to $10 in returns [7] |
| Decarbonization-Accelerated | Energy and carbon reduction | Lower OPEX over time; higher near-term capital outlay |
| Balanced / Baseline | Risk-based renewal | Optimized lifecycle costs; most defensible for public scrutiny |
This kind of scenario modeling is not just theory. Sugar Land used it to redirect bond funding toward higher-risk water mains [6].
Fourth deliverable: an initial 5–20 year investment roadmap
The deliverable here is a phased 5- to 20-year roadmap. In the near term, the focus should stay on High-High and High-Medium risk assets, regulatory compliance projects, and the top carbon priority projects identified earlier [7].
Later phases can pick up larger renewals, resilience work, and decarbonization projects that need more planning time.
For each phase, spell out:
- Annual spend profiles
- Funding sources
- Operating budget impacts from future maintenance [3]
That level of detail makes the roadmap explicit and audit-ready, so leadership can see how the plan handles risk, carbon, and budget limits over time.
Conclusion: Start simple, make priorities visible, and update the plan regularly
Once the first roadmap is drafted, the job changes. It moves from analysis to upkeep. Start with a trusted asset baseline, turn that into condition and risk views, rank carbon and energy priorities, and then build a phased roadmap from there. You do not need perfect data on day one. You need decisions you can defend. The work starts with a minimum viable baseline and gets better with each cycle.
By the end of the first cycle, leaders should have a baseline, a risk view, a carbon priority list, and a phased investment roadmap. Sustainable investment planning is a repeatable process for choosing the next best dollar, not a one-time capital exercise.
Small and mid-sized cities can begin with triage-level screening. The bigger risk is waiting for perfect data while the funding gap keeps growing. That’s why the plan should work like a live tool, not sit on a shelf like a one-time report.
Update the CIP each year, close the highest-value data gaps each quarter, and compare forecasts with actual outcomes [3][6]. The aim is a framework that improves every cycle, so aging-asset renewal and decarbonization goals push in the same direction instead of competing.
Start simple. Make the trade-offs visible. Improve the plan every year.
FAQs
How do we start with incomplete asset data?
Many municipalities begin with gaps in their data. The first step is to audit the asset inventory you already have and gather what’s scattered across the organization: staff knowledge, work order history, maps, and both digital and paper records.
From there, send field teams out to close the gaps with a standard 1–5 condition scale. Once those ratings are in place, convert them into risk scores by looking at the chance of failure and the social, financial, and environmental impact if that failure happens. That gives you a clear, defensible, risk-based investment roadmap.
Which assets should we prioritize first?
Start by taking stock of your physical infrastructure so you have a clear asset baseline. From there, use a multi-criteria risk framework to rank assets in a consistent, objective way.
Prioritize assets based on:
- Risk and consequence of failure
- Exposure to hazards and limited capacity to respond
- Strategic and regulatory alignment
- Immediate public safety risks
How do carbon goals fit into capital planning?
Carbon goals belong in capital planning because they shape the choices cities and utilities make with their money. Instead of treating carbon as a side issue, they look at each proposed investment through a climate lens.
That means weighing the embodied carbon tied to construction and materials, the operational emissions an asset will produce over its full life, the social cost of carbon, and possible policy shifts that could change the math later. This helps decision-makers put more weight on projects that support net-zero goals and cut stranded-asset risk.